ViewTube

ViewTube
Sign inSign upSubscriptions
Filters

Upload date

Type

Duration

Sort by

Features

Reset

96 results

Tpoint Tech
Complete Matplotlib Course in 40 Minutes | Learn Data Visualization with Python

Enquiry: https://forms.gle/dhZhETccxuQTCBQB9 Learn Matplotlib in Python from scratch with this complete beginner-friendly ...

40:36
Complete Matplotlib Course in 40 Minutes | Learn Data Visualization with Python

62 views

13h ago

Himat Academy
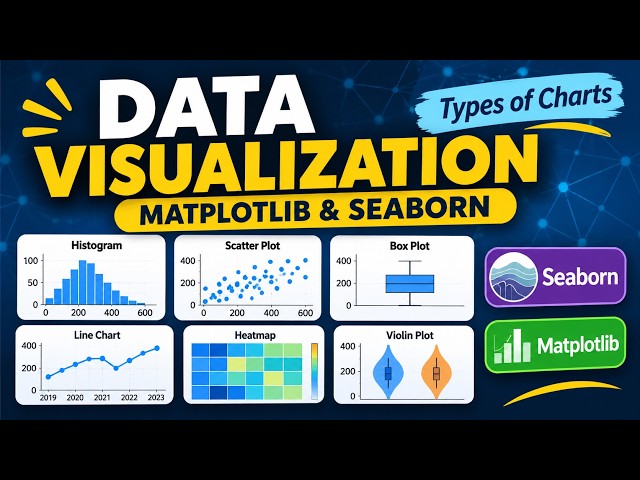
Data Visualization in Python | Matplotlib & Seaborn | Types of Charts | M6

Welcome to Module 6: Data Visualization with Python! In this lesson, we explore different types of data visualization charts using ...

27:41
Data Visualization in Python | Matplotlib & Seaborn | Types of Charts | M6

29 views

9h ago

Nemelion_Tronic
MATPLOTLIB - Animation de courbe

python #pythonprogramming #matplotlib #capcut #fyp #gabon #france #edit.

5:40
MATPLOTLIB - Animation de courbe

0 views

4h ago

SyntaxPilot
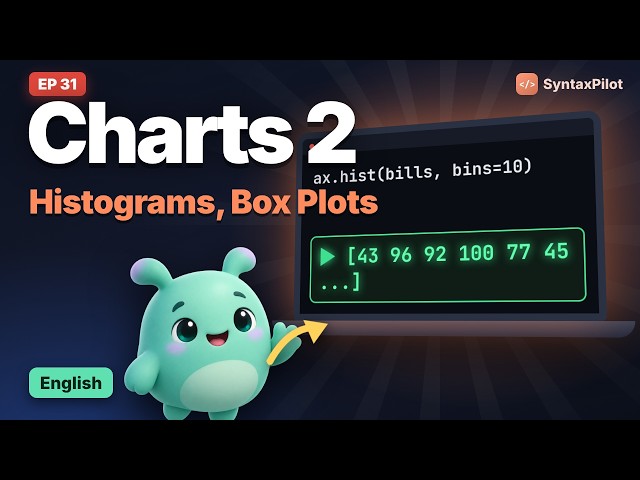
Data Analytics Tutorial #31 | See how your data is spread, related and compared

Data Analytics Tutorial: Episode 31 of SyntaxPilot's free Data Analytics full course, with real-life examples for every concept.

15:45
Data Analytics Tutorial #31 | See how your data is spread, related and compared

0 views

8h ago

Leonardo Hernández
Minicurso de Python · Ep 24: Gráficas con Matplotlib

Cómo convences a un gerente en 5 segundos? En este episodio del Minicurso de Python aprendes: bar compara · plot muestra ...

2:47
Minicurso de Python · Ep 24: Gráficas con Matplotlib

0 views

1h ago

Top VarSity
Python Full Course 2027 | Python for Data Analytics 2027 | Data Analysis with Python 2027

Microsoft Azure - Data Analyst Course ...

9:58:16
Python Full Course 2027 | Python for Data Analytics 2027 | Data Analysis with Python 2027

604 views

12h ago

だれでもパイソン (Python for All)
Calculating and Visualizing Pi: Python for Everyone, Episode 150

To make programming enjoyable for both adults and children, we will explain various Python programming concepts. Let's learn ...

20:17
Calculating and Visualizing Pi: Python for Everyone, Episode 150

1 view

6h ago

Jacob Isah Programming Hub
My First 5 Python Projects in Jupyter (Beginner Friendly)

Build five practical Python projects in Jupyter Notebook to move beyond basic examples and gain hands-on coding experience.

15:33
My First 5 Python Projects in Jupyter (Beginner Friendly)

3 views

7h ago

Neural Casts
SciPy 1.0: fundamental algorithms for scientific computing in Python — Pauli Virtanen et al.

SciPy 1.0—Fundamental Algorithms for Scientific Computing in Python by Pauli Virtanen, Ralf Gommers, Travis E. Oliphant, Matt ...

1:14:09
SciPy 1.0: fundamental algorithms for scientific computing in Python — Pauli Virtanen et al.

6 views

10h ago

DiMathData
Cómo dibujar un histograma con numpy y pandas y matplotlib
35:07
Cómo dibujar un histograma con numpy y pandas y matplotlib

0 views

5h ago

LearnCoachAssistWatch
Data Visualization in Python: Scales, Axes, Ticks

Learn data visualization in plain Python covering scales, axes, breaks, and ticks. You build a linear axis, a log axis with powers of ...

5:12
Data Visualization in Python: Scales, Axes, Ticks

1 view

16h ago