Upload date
All time
Last hour
Today
This week
This month
This year
Type
All
Video
Channel
Playlist
Movie
Duration
Short (< 4 minutes)
Medium (4-20 minutes)
Long (> 20 minutes)
Sort by
Relevance
Rating
View count
Features
HD
Subtitles/CC
Creative Commons
3D
Live
4K
360°
VR180
HDR
67,505 results
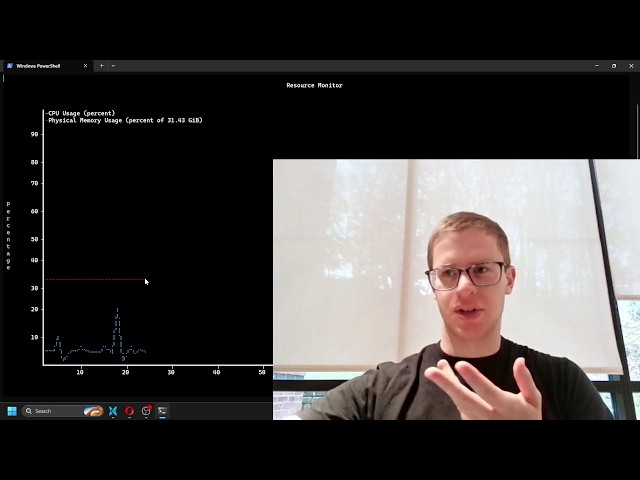
code in video: https://github.com/Magicalbat/videos/blob/main/braille.c term_plot.h: https://github.com/Magicalbat/term-plot blot: ...
19,293 views
8d ago
Master complete data visualization in Python from scratch and build stunning charts in this Matplotlib full course 0:00 Why ...
6 views
21h ago
Every machine learning project starts with data: loading it, cleaning it, and looking at it. This video teaches the three Python tools ...
16 views
3d ago
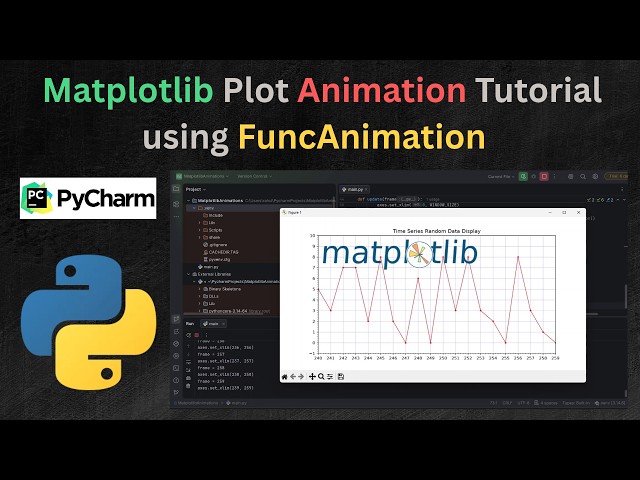
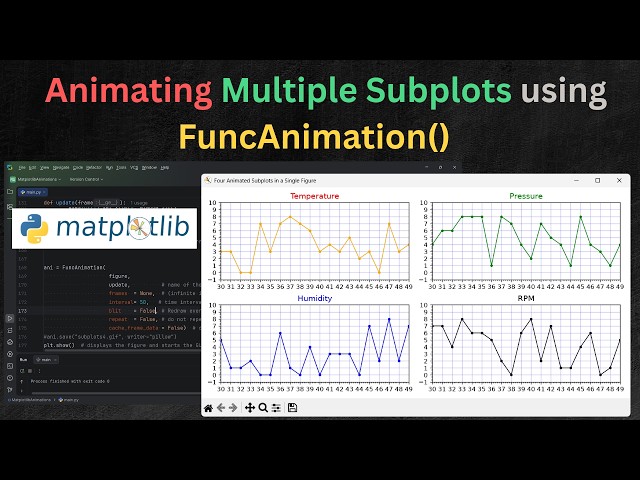
Like and Subscribe In this tutorial ,You will learn to create animated Matplotlib plots using the FuncAnimation() class and Python ...
290 views
2w ago
In this tutorial, Learn how to animate multiple plots (axes) inside a single matplotlib window (figure) in real time concurrently using ...
24 views
6h ago
Learn C++ and Python from Zero to Hero! Are you ready to master C++ or Python from scratch? Whether you're a beginner or ...
88 views
Professional charts with Matplotlib: figures and axes, line and bar charts, number formatting, legends, histograms, scatter plots, ...
17 views
1d ago
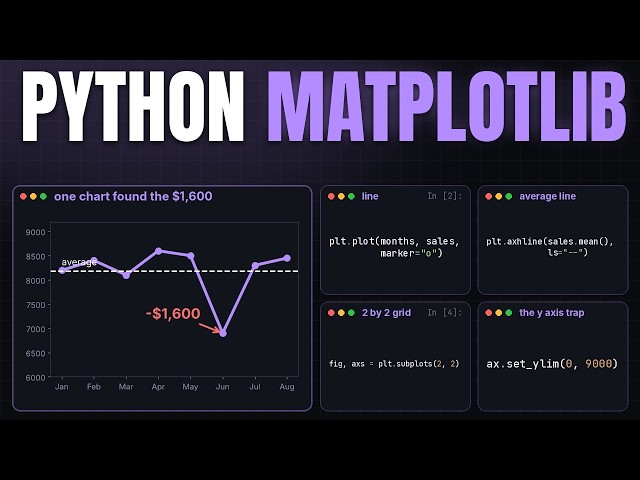
A coffee shop lost 1600 dollars in one month and the owner could not see why in her spreadsheet. One line chart showed it ...
Learn Matplotlib with Coding Kitty! Create line, bar, and scatter plots, histograms, and pie charts. Discover how to customize colors ...
3 views
4d ago
Learn Charts 2 in Python, step by step, with real code you can run: Load pandas and matplotlib, Read the real day.csv file, ...
256 views
Learn Charts 2 in Python, step by step, with real code you can run: Why not a line?, Load pandas and matplotlib again, Read ...
1 view
Learn Python Data Visualization in 5 Minutes! In this step-by-step Python tutorial, you'll learn how to create professional bar charts ...
46 views
3w ago
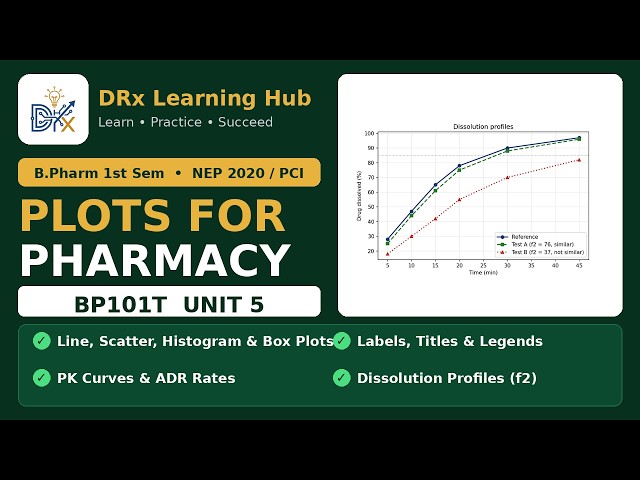
Learn Data Visualization with Matplotlib in Python for B.Pharm — line plots, scatter plots, histograms, bar charts and box plots, ...
12 views
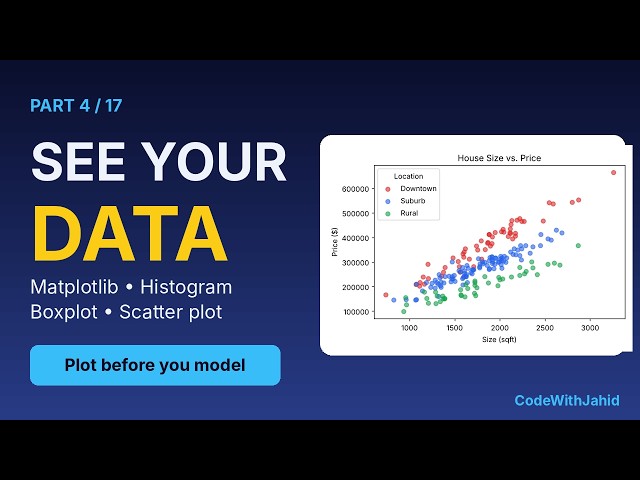
Plot before you model! In Part 4 of the CodeWithJahid machine learning course, you learn how to look at your data with charts, ...
15 views
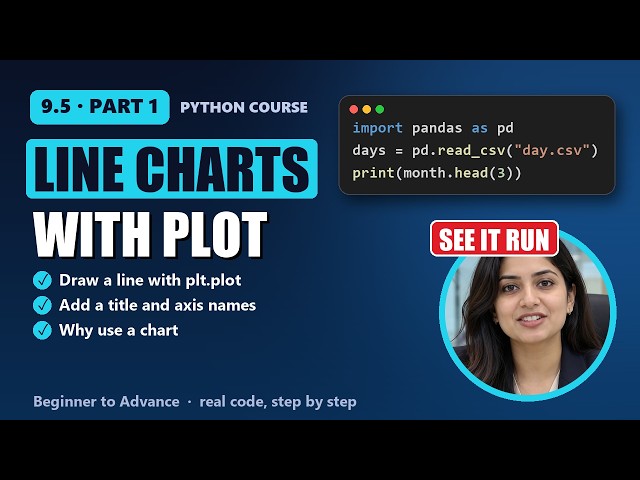
Learn Charts 1 in Python, step by step, with real code you can run: Why use a chart, Parts of a chart, Import pandas and matplotlib ...
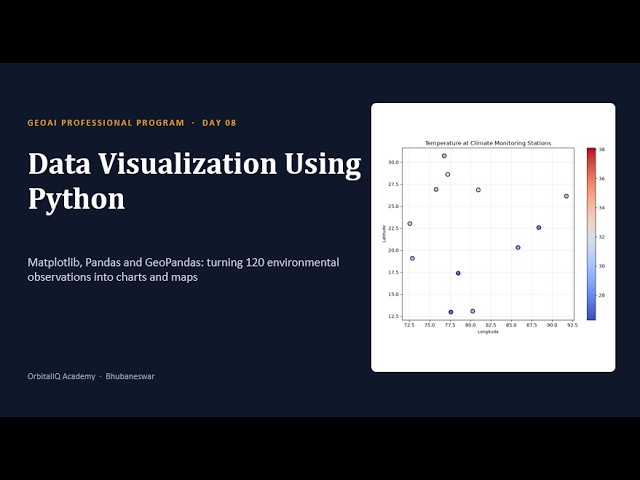
GeoAI Professional Program | Day 08** Welcome to Day 08 of the GeoAI Professional Program by **OrbitalIQ Academy**.
29 views
2d ago
Learn how to visualize data like a pro with Python! In this video, you'll get an Introduction to Matplotlib, one of the most popular ...
7 views
6d ago
Enquiry: https://forms.gle/dhZhETccxuQTCBQB9 Learn Matplotlib in Python from scratch with this complete beginner-friendly ...
140 views
Turn an Excel spreadsheet into a line chart, a bar chart, a pie chart and a full dashboard with a few lines of Python. Step by step ...
13 views
10d ago
Description: Ready to visualize data on the web using Python? In this step-by-step tutorial, we continue our series on building 8 ...
96 views
9d ago