Upload date
All time
Last hour
Today
This week
This month
This year
Type
All
Video
Channel
Playlist
Movie
Duration
Short (< 4 minutes)
Medium (4-20 minutes)
Long (> 20 minutes)
Sort by
Relevance
Rating
View count
Features
HD
Subtitles/CC
Creative Commons
3D
Live
4K
360°
VR180
HDR
108 results
Lesson 42 of the Python Data Analytics Full Course: Tennis Pace of Play: Who Slows the Game Down?. Today we're on the tennis ...
6 views
12h ago
What to Learn Before Writing Your First Line of AI Code (Python Roadmap) Most beginners don't quit AI because it's too ...
4 views
9h ago
Exploratory data analysis using Python, from a clean file to a short findings note: an EDA project step by step with pandas and ...
9 views
21h ago
Python Data Visualization Part 2 | Matplotlib Charts & Graphs | Day 20** Welcome to **Day 20 of the Python Tutorial Series!
5 views
13h ago
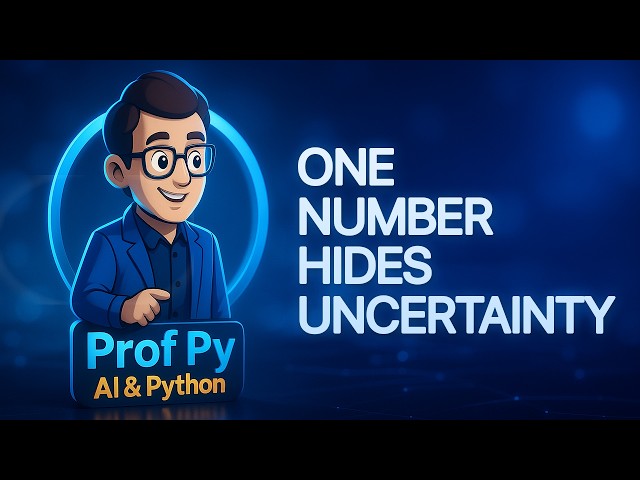
Bayesian logistic regression: plot 90% pointwise probability bands to visualize uncertainty and compare sparse vs dense datasets ...
1 view
14h ago
PYTHON with AI (CORE & ADVANCED) Online Training @ DURGASOFT ...
3 views
14 min ago
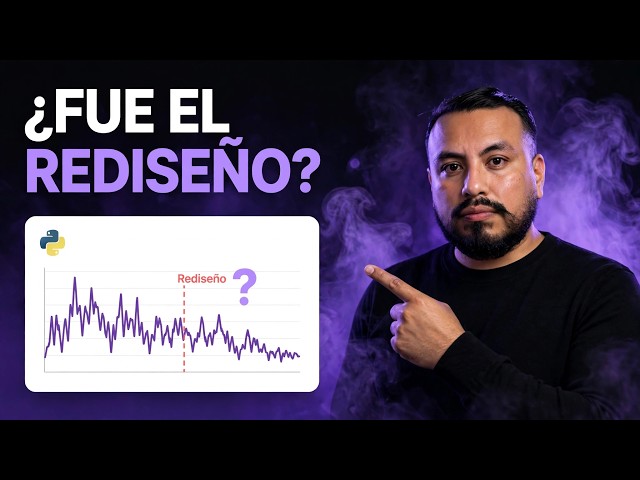
Las visitas de tu blog cayeron y todos culpan al rediseño de agosto. ¿Seguro? En este proyecto real lo comprobamos con un ...
25 views
1d ago
How I made the trailer for The Last Letter, my film about Srinivasa Ramanujan, and the tool behind every step: the script, the ...
23 views
22h ago
Learn Linear Regression in Machine Learning with Python through a practical, hands-on implementation using Google Colab!
426 views
18h ago
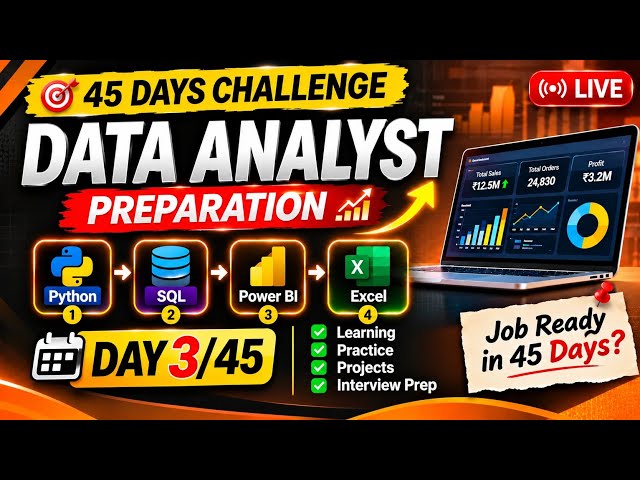
45 DAYS DATA ANALYST PREPARATION CHALLENGE – DAY 3 Welcome to my 45 Days Data Analyst Preparation ...
12 views
Streamed 18h ago
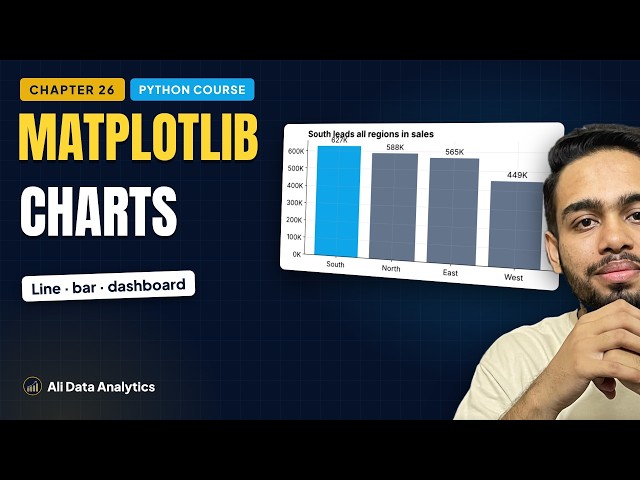
Professional charts with Matplotlib: figures and axes, line and bar charts, number formatting, legends, histograms, scatter plots, ...
13 views
Master complete data visualization in Python from scratch and build stunning charts in this Matplotlib full course 0:00 Why ...
10h ago
From a handful of sand to a charging laptop: every step in between, in one video. The full solar pipeline in four parts: purifying ...