ViewTube

ViewTube
Sign inSign upSubscriptions
Filters

Upload date

Type

Duration

Sort by

Features

Reset

194 results

MySkill
Short Class Data Visualization with Microsoft Excel | MySkill

Halo Bestie✨ Yuk, simak materi "Data Visualization with Microsoft Excel" dari tutor berpengalaman di Short Class Microsoft Excel ...

1:54:13
Short Class Data Visualization with Microsoft Excel | MySkill

3,429 views

Streamed 1d ago

DataCamp
AI-Powered Data Analysis with Excel & Claude

Session Resources: https://bit.ly/4zpZP4D Register for this session: ...

1:04:45
AI-Powered Data Analysis with Excel & Claude

3,126 views

Streamed 4h ago

Vedakarna
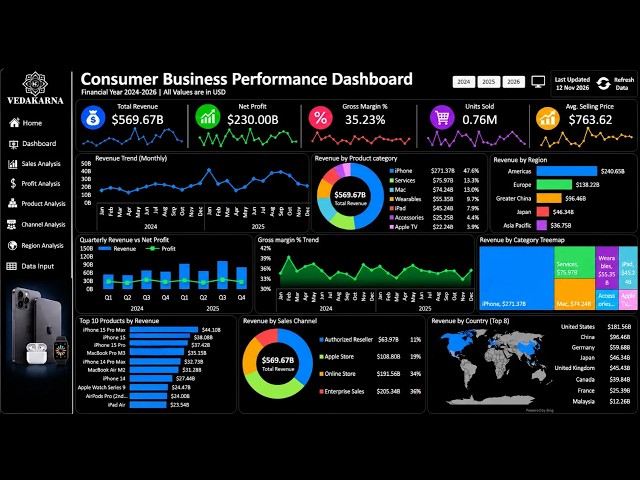
Create a Interactive Consumer Performance Dashboard in Excel | Beginner to Pro

Free Dashboard: https://vedakarna.com/templates WhatsApp: https://whatsapp.com/channel/0029VbCIu9XHVvTSpnBDWr0e ...

21:52
Create a Interactive Consumer Performance Dashboard in Excel | Beginner to Pro

4,123 views

5d ago

Excel Visual
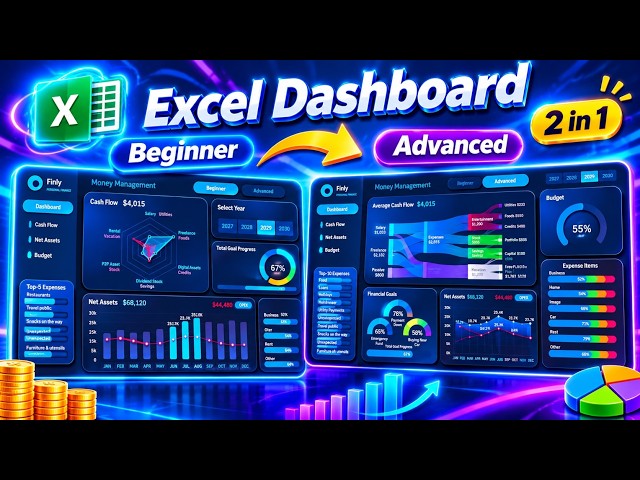
How to Build an Excel Dashboard for Managing Personal Finances Beginner to Advanced

... for Managing Personal Finances Stress-Free • Go from Beginner to Advanced in Excel data visualization • See the real process ...

3:07:43
How to Build an Excel Dashboard for Managing Personal Finances Beginner to Advanced

693 views

1d ago

Vizspire
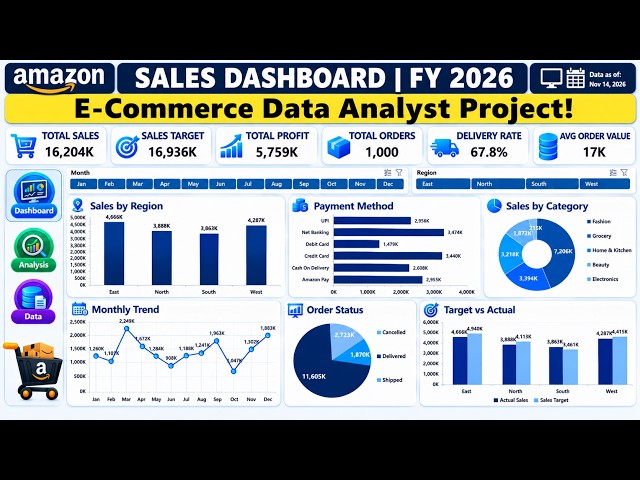
COMPLETE E-Commerce Data Analytics Project | Excel Dashboard | End-to-End Analyst Portfolio Project

JOIN OUR COMMUNITY & STAY UPDATED: WhatsApp Channel: https://whatsapp.com/channel/0029Vb8mtfx7IUYZIFVAqU1Y ...

22:33
COMPLETE E-Commerce Data Analytics Project | Excel Dashboard | End-to-End Analyst Portfolio Project

999 views

4d ago

Mathew K Analytics
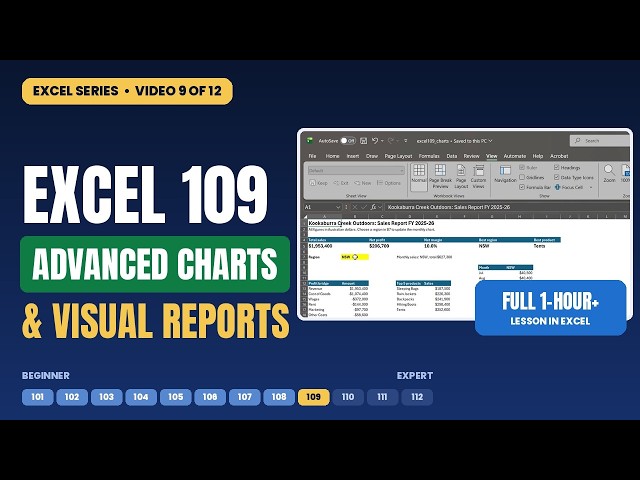
Advanced Excel Charts Full Course: Waterfall, Funnel, Dynamic Charts & Reports | Excel 109

Go beyond the default chart. Learn what makes a chart clear, then build the modern chart types and a one-page visual report.

1:05:02
Advanced Excel Charts Full Course: Waterfall, Funnel, Dynamic Charts & Reports | Excel 109

6 views

12h ago

Muhammad Alfarizi
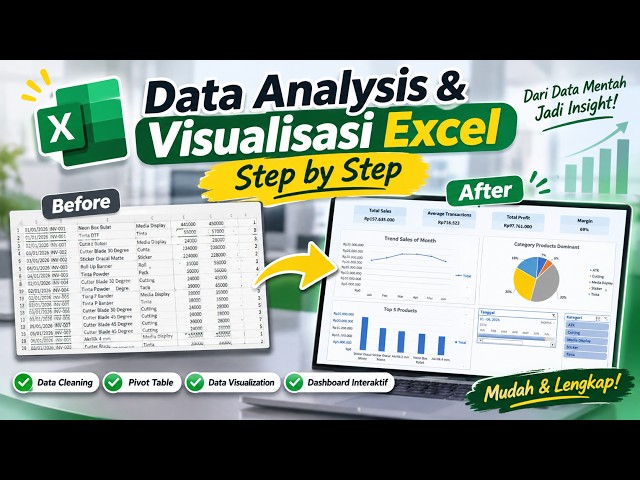
Data Analysis & Visualization Using Microsoft Excel | Step-by-Step Tutorial

In this project, I performed sales data analysis using Microsoft Excel to building an interactive dashboard. In this video you will ...

48:53
Data Analysis & Visualization Using Microsoft Excel | Step-by-Step Tutorial

7 views

6d ago

Top Courses
Build an AI Data Analysis & Cleaning Agent in Excel with Copilot

Learn how to automate data analysis and simplify data management in Excel using Microsoft 365 Copilot. In this comprehensive ...

38:36
Build an AI Data Analysis & Cleaning Agent in Excel with Copilot

35 views

5d ago

My Online Master
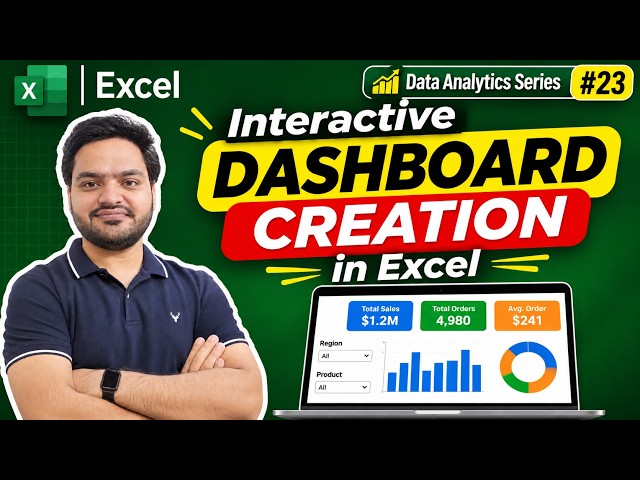
Make an Interactive Excel Dashboard From Scratch (Full Tutorial)

Learn how to create an interactive dashboard in Microsoft Excel using Charts and Slicers with this practical tutorial from our Data ...

29:26
Make an Interactive Excel Dashboard From Scratch (Full Tutorial)

70 views

2d ago

Blujay Technologies
EXCEL | PART-12 | How to Create an Interactive Excel Dashboard | Pivot Charts, Slicers & KPIs

Excel Dashboard Tutorial for Data Analysts | Pivot Tables, Charts, Slicers & KPIs Welcome to BluJay Technologies! In this Data ...

52:06
EXCEL | PART-12 | How to Create an Interactive Excel Dashboard | Pivot Charts, Slicers & KPIs

23 views

1d ago

Data Tutorials
Excel for Data Analysis Full Course 2027 | Learn Excel, Pivot Tables, Dashboards & Projects #excel

excel #dataanalytics #exceltutorial PACKAGED COURSES ✓ Power BI + SQL + Python + Fabric + Projects Course ...

9:46:36
Excel for Data Analysis Full Course 2027 | Learn Excel, Pivot Tables, Dashboards & Projects #excel

8,765 views

2d ago

Discover Talent™
SQL to Excel Dashboard: End-to-End Sales Data Analysis Tutorial

SQL to Excel Dashboard: End-to-End Sales Data Analysis Tutorial Master SQL and Excel for real-world business analytics!

50:51
SQL to Excel Dashboard: End-to-End Sales Data Analysis Tutorial

28 views

6h ago

Learn with Elen 📖📚
🚀  𝗕𝘂𝗶𝗹𝗱 𝗮𝗻 𝗜𝗻𝘁𝗲𝗿𝗮𝗰𝘁𝗶𝘃𝗲 𝗘𝘅𝗰𝗲𝗹 𝗗𝗮𝘀𝗵𝗯𝗼𝗮𝗿𝗱 𝗳𝗿𝗼𝗺 𝟮 𝗗𝗮𝘁𝗮𝘀𝗲𝘁𝘀! | 𝗣𝗼𝘄𝗲𝗿 𝗤𝘂𝗲𝗿𝘆, 𝗣𝗶𝘃𝗼𝘁 𝗧𝗮𝗯𝗹𝗲 & 𝗙𝗼𝗿𝗺𝘂𝗹𝗮𝘀 🚀

Hello and a very good day everyone, In this 27-minute #tutorial, I #shared how to #transform two different datasets into an ...

27:44
🚀 𝗕𝘂𝗶𝗹𝗱 𝗮𝗻 𝗜𝗻𝘁𝗲𝗿𝗮𝗰𝘁𝗶𝘃𝗲 𝗘𝘅𝗰𝗲𝗹 𝗗𝗮𝘀𝗵𝗯𝗼𝗮𝗿𝗱 𝗳𝗿𝗼𝗺 𝟮 𝗗𝗮𝘁𝗮𝘀𝗲𝘁𝘀! | 𝗣𝗼𝘄𝗲𝗿 𝗤𝘂𝗲𝗿𝘆, 𝗣𝗶𝘃𝗼𝘁 𝗧𝗮𝗯𝗹𝗲 & 𝗙𝗼𝗿𝗺𝘂𝗹𝗮𝘀 🚀

14 views

4d ago

عصام الصياد
Practical Exercise - 4 | Ep. 84 | Microsoft Power BI Data Analysis Diploma

Start Your Complete Learning Journey with Essam Academy Membership! Join the (Channel Membership) to get access to all ...

31:25
Practical Exercise - 4 | Ep. 84 | Microsoft Power BI Data Analysis Diploma

497 views

6h ago

iData Global 数据分析培训保offer就业直通车
数据分析 } Excel data visualization

https://www.youtube.com/playlist?list=PLPR6jyIcEUTA0jIrBiWrupUH5yF_Opzb3 ...

3:24:20
数据分析 } Excel data visualization

151 views

Streamed 6d ago

Full IT Operations Courses
Microsoft Power BI: Desktop Setup, DAX & Visuals Explained

Microsoft Power BI lesson: get Power BI Desktop running, learn the interface, write basic DAX, and build tables, cards, slicers, and ...

1:04:50
Microsoft Power BI: Desktop Setup, DAX & Visuals Explained

28 views

6d ago

Dex Academy
Power BI Tutorial for Beginners | Build Your First Interactive Dashboard (Full Course)

Ready to learn Power BI and start building professional dashboards? In this beginner-friendly Power BI tutorial, I'll walk you ...

1:02:15
Power BI Tutorial for Beginners | Build Your First Interactive Dashboard (Full Course)

103 views

6d ago

jainzanalyst
Master the Excel Insert Tab: Pivot Tables, Charts & Slicers (Full Tutorial)  | #excel #exceltips

Master the entire Excel Insert Tab from start to finish! In this complete tutorial, we cover everything you need to know to organize, ...

1:52:32
Master the Excel Insert Tab: Pivot Tables, Charts & Slicers (Full Tutorial) | #excel #exceltips

99 views

7d ago

Bas Dohmen | Data Training
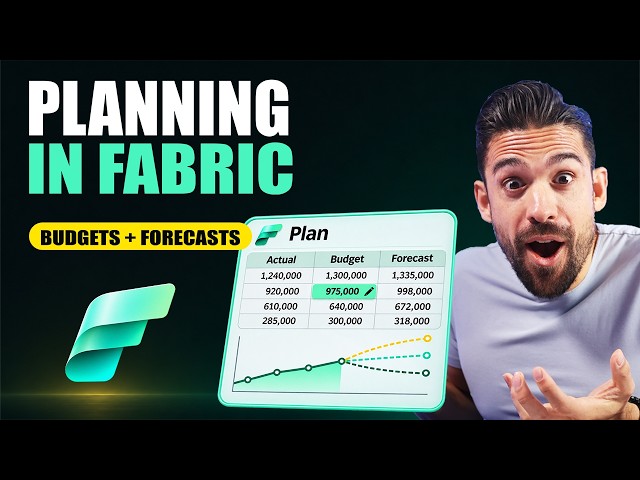
Your CFO Will Want This: Planning in Fabric

Planning in Fabric is here, and it brings budgeting and forecasting right next to your data! You can build budgets, forecasts and ...

28:34
Your CFO Will Want This: Planning in Fabric

33,595 views

6d ago

CA Chandan Rai
Excel Tutorial from Basic to Advanced for Data Analyst📊 | Learn excel in 2026 | Part 4 | Pivot Table

MASTER MICROSOFT EXCEL IN 2026 – FROM BASIC TO ADVANCED | PART 4 | PIVOT TABLE & MAIL MERGE Welcome to CA ...

42:54
Excel Tutorial from Basic to Advanced for Data Analyst📊 | Learn excel in 2026 | Part 4 | Pivot Table

44 views

4d ago