ViewTube

ViewTube
Sign inSign upSubscriptions
Filters

Upload date

Type

Duration

Sort by

Features

Reset

662 results

5 Minutes Engineering
Matplotlib Full Course in One Shot | Data Visualization for Data Science and Data Analytics in Hindi

FREE CODE & DATASET AVAILABLE ON Official 5 Minutes Engineering Whatsapp Channel Description ...

2:37:58
Matplotlib Full Course in One Shot | Data Visualization for Data Science and Data Analytics in Hindi

6,434 views

3w ago

Mekha Camerin
Day 5 AI 1month matplotlib & seaborn
1:17:49
Day 5 AI 1month matplotlib & seaborn

3 views

3w ago

Tpoint Tech
Complete Matplotlib Course in 40 Minutes | Learn Data Visualization with Python

Enquiry: https://forms.gle/dhZhETccxuQTCBQB9 Learn Matplotlib in Python from scratch with this complete beginner-friendly ...

40:36
Complete Matplotlib Course in 40 Minutes | Learn Data Visualization with Python

63 views

13h ago

Magicalbat
matplotlib but in the terminal

code in video: https://github.com/Magicalbat/videos/blob/main/braille.c term_plot.h: https://github.com/Magicalbat/term-plot blot: ...

34:15
matplotlib but in the terminal

17,468 views

5d ago

Entri Coding தமிழ்
Data Science Full Course for Beginners 2027 🔥 | Python, Pandas, Matplotlib & Seaborn – Part 2

To enquire about our AI driven courses, Fill the form below https://interest.entri.app/uRsgYKm Enquiry / Counselling: ...

20:52
Data Science Full Course for Beginners 2027 🔥 | Python, Pandas, Matplotlib & Seaborn – Part 2

862 views

3w ago

Marco Campolo
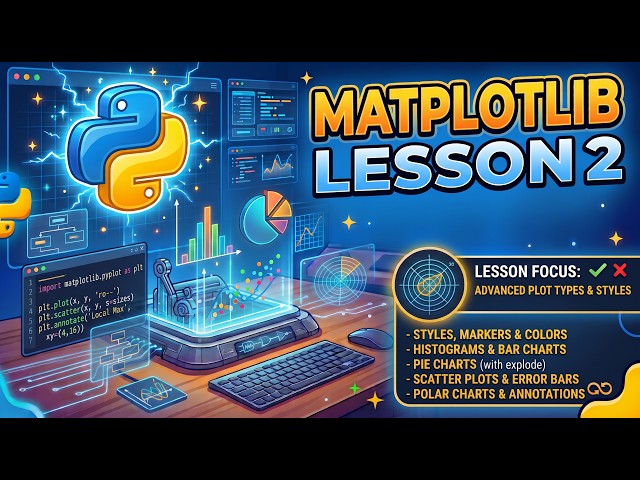
Matplotlib Lesson 2: Advanced Plot Types, Styling & Annotations

Take your Python data visualizations to the next level! In Lesson 2 of our Matplotlib series, we move beyond basic line graphs and ...

38:00
Matplotlib Lesson 2: Advanced Plot Types, Styling & Annotations

16 views

2w ago

xanthium.enterprises
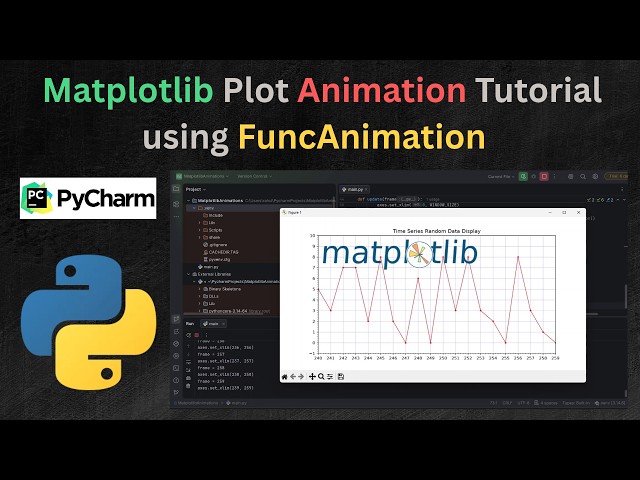
Matplotlib Real time Plot Animation Tutorial using FuncAnimation() and Python for Beginners

Like and Subscribe In this tutorial ,You will learn to create animated Matplotlib plots using the FuncAnimation() class and Python ...

28:08
Matplotlib Real time Plot Animation Tutorial using FuncAnimation() and Python for Beginners

257 views

2w ago

Steve Learning
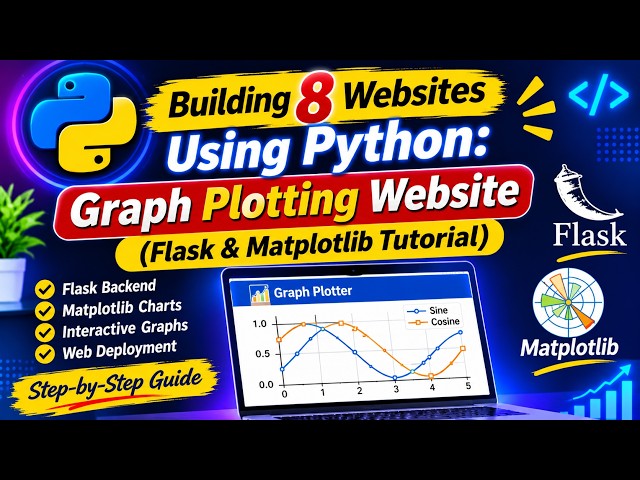
Building 8 Websites Using Python: Graph Plotting Website (Flask & Matplotlib Tutorial)

Description: Ready to visualize data on the web using Python? In this step-by-step tutorial, we continue our series on building 8 ...

29:06
Building 8 Websites Using Python: Graph Plotting Website (Flask & Matplotlib Tutorial)

81 views

6d ago

Mathew K Analytics
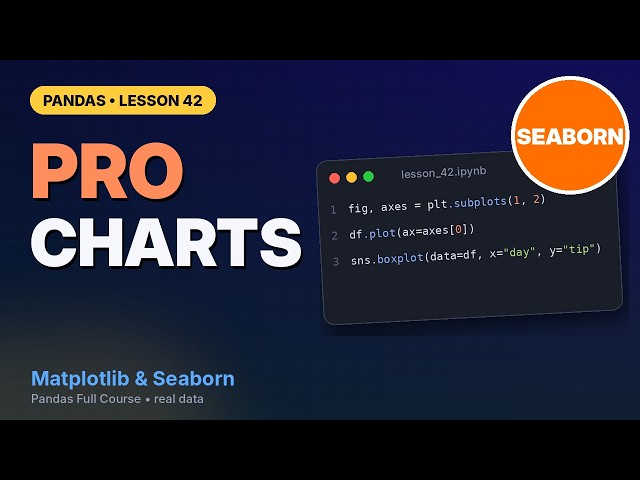
Pandas + Matplotlib + Seaborn: Make Professional Charts in Python | Pandas Course #42

Do weekend diners tip better than weekday diners? It sounds like a one-chart question, but the honest answer takes a few charts ...

22:51
Pandas + Matplotlib + Seaborn: Make Professional Charts in Python | Pandas Course #42

23 views

4d ago

Diego Vera
Live Self-Study: Computer Science, NumPy, Pandas & Matplotlib | Learning in Public

Join me for another live self-study session as I continue working through computer science, Python, and scientific computing.

1:36:21
Live Self-Study: Computer Science, NumPy, Pandas & Matplotlib | Learning in Public

54 views

Streamed 2w ago

Programming Avec Reza
The Only Matplotlib Tutorial You Need - From 0 To Pro in 5 Hours

Learn C++ and Python from Zero to Hero! Are you ready to master C++ or Python from scratch? Whether you're a beginner or ...

4:55:55
The Only Matplotlib Tutorial You Need - From 0 To Pro in 5 Hours

77 views

6d ago

The Course Library
Matplotlib in Python Explained | Create Beautiful Charts & Graphs #python #coding

Learn how to create beautiful charts and graphs using Matplotlib in Python! In this beginner-friendly tutorial, you'll discover how to ...

23:24
Matplotlib in Python Explained | Create Beautiful Charts & Graphs #python #coding

7 views

4w ago

Lean Sigma
Python  Data Visualization with Matplotlib

Welcome to the Data Visualization session of the AI-Powered Data Science & Machine Learning Professional Bootcamp by Lean ...

1:07:27
Python Data Visualization with Matplotlib

8 views

2w ago

VPro Skills
Matplotlib in Python | Line Plot & Bar Chart | Data Visualization with Practical Examples

Short Description:** Learn Data Visualization using Matplotlib in Python with practical coding examples. Understand how to create ...

52:23
Matplotlib in Python | Line Plot & Bar Chart | Data Visualization with Practical Examples

86 views

6d ago

Mathew K Analytics
Pandas Full Course Part 4 (6.5 Hours): Visualisation, Big Data & Machine Learning Prep in Python

Part 4 of the complete Pandas Full Course (65 lessons, 5 parts). Make charts straight from pandas, Matplotlib, Seaborn and Plotly, ...

6:27:06
Pandas Full Course Part 4 (6.5 Hours): Visualisation, Big Data & Machine Learning Prep in Python

70 views

3w ago

Marco Campolo
Matplotlib Lesson 4: Master 3D Plotting in Python (Scatter, Surface & Wireframes)

Ready to take your data into the third dimension? In Lesson 4 of our Matplotlib series, we are leaving flat graphs behind and ...

29:48
Matplotlib Lesson 4: Master 3D Plotting in Python (Scatter, Surface & Wireframes)

9 views

2d ago

VPro Skills
Matplotlib in Python | Line Plot & Bar Chart | Data Visualization with Practical Examples

Short Description:** Learn Data Visualization using Matplotlib in Python with practical coding examples. Understand how to create ...

1:03:53
Matplotlib in Python | Line Plot & Bar Chart | Data Visualization with Practical Examples

40 views

7d ago

Python DeCal
[Class 15] Matplotlib
49:16
[Class 15] Matplotlib

14 views

3w ago

Neural Casts
Matplotlib: A 2D Graphics Environment — John D. Hunter

Matplotlib: A 2D Graphics Environment by John D. Hunter Watch the concise version: ...

38:19
Matplotlib: A 2D Graphics Environment — John D. Hunter

62 views

7d ago

Coding Macaw Bootcamp
Day 6: Python for Data Analysis II | Pandas Data Wrangling & Matplotlib

Welcome to Day 6 of Coding Macaw's 10-Day Foundational Data Analytics with GenAI Bootcamp! Today, we take your Python ...

2:01:48
Day 6: Python for Data Analysis II | Pandas Data Wrangling & Matplotlib

21 views

3w ago