Upload date
All time
Last hour
Today
This week
This month
This year
Type
All
Video
Channel
Playlist
Movie
Duration
Short (< 4 minutes)
Medium (4-20 minutes)
Long (> 20 minutes)
Sort by
Relevance
Rating
View count
Features
HD
Subtitles/CC
Creative Commons
3D
Live
4K
360°
VR180
HDR
134 results
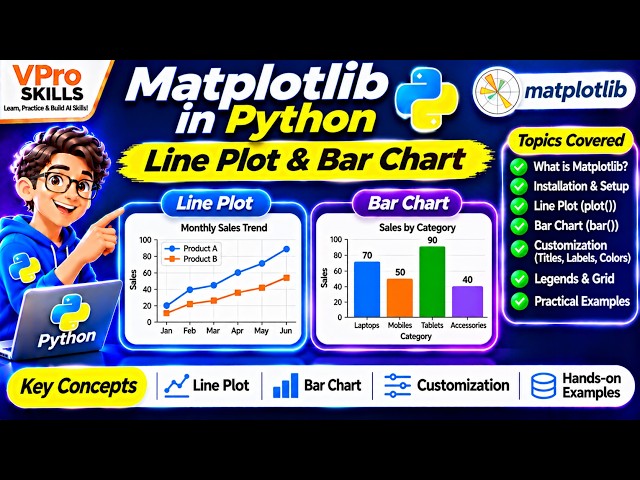
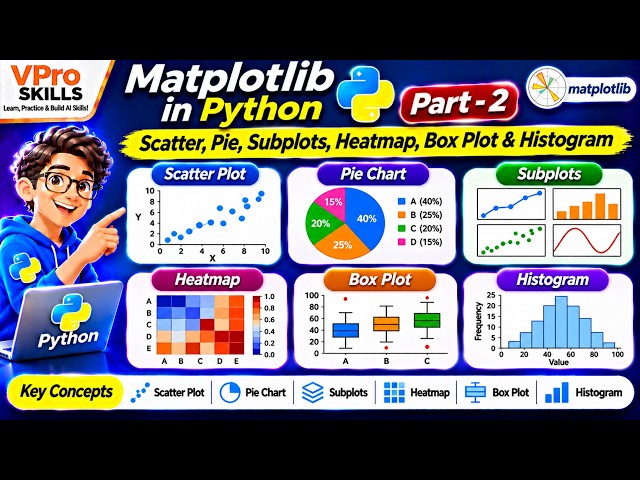
Enquiry: https://forms.gle/dhZhETccxuQTCBQB9 Learn Matplotlib in Python from scratch with this complete beginner-friendly ...
62 views
13h ago
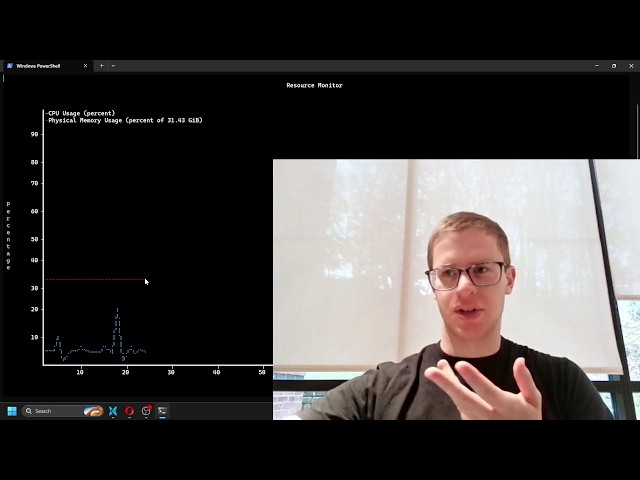
code in video: https://github.com/Magicalbat/videos/blob/main/braille.c term_plot.h: https://github.com/Magicalbat/term-plot blot: ...
17,468 views
5d ago
Learn C++ and Python from Zero to Hero! Are you ready to master C++ or Python from scratch? Whether you're a beginner or ...
77 views
6d ago
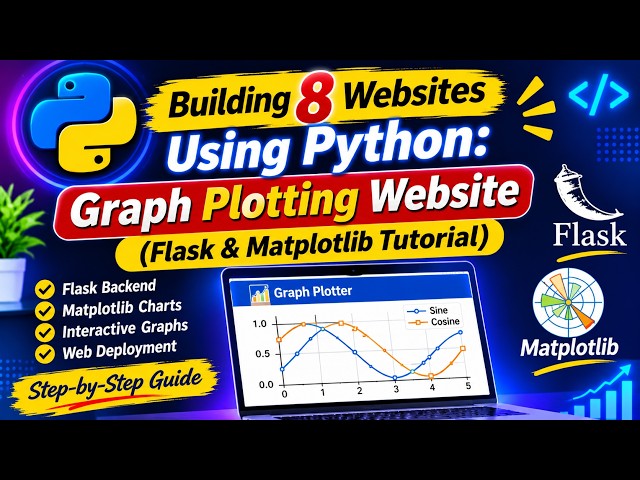
Description: Ready to visualize data on the web using Python? In this step-by-step tutorial, we continue our series on building 8 ...
81 views
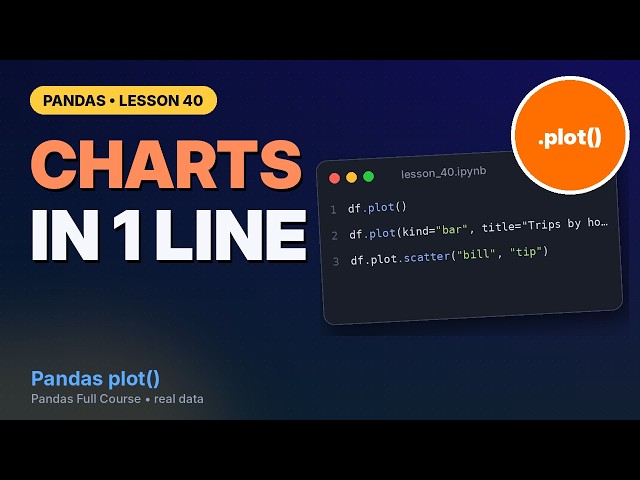
Do weekend diners tip better than weekday diners? It sounds like a one-chart question, but the honest answer takes a few charts ...
23 views
4d ago
Short Description:** Learn Data Visualization using Matplotlib in Python with practical coding examples. Understand how to create ...
86 views
10 views
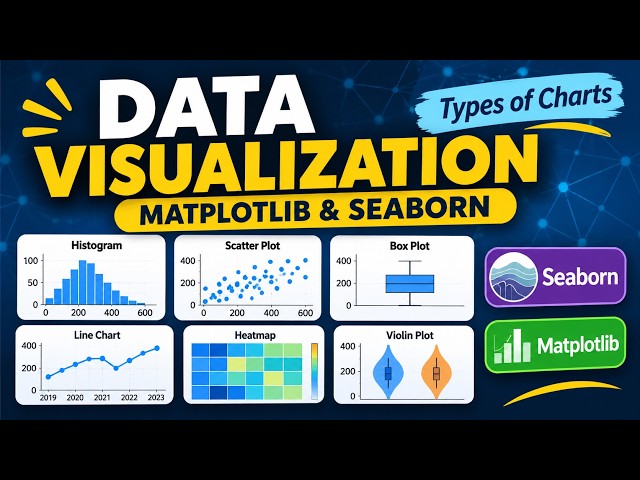
Welcome to Module 6: Data Visualization with Python! In this lesson, we explore different types of data visualization charts using ...
29 views
9h ago
Short Description:** Continue learning Data Visualization using Matplotlib in Python with practical coding examples. Explore ...
21 views
A table of 24 numbers hides its story. Put the same numbers on a chart, and the pattern jumps out in a second. Today you'll make ...
Course: Business Analytics with Python Instructor: Prof. Dr. Dr. Claire Y.T. Chen Teaching Assistant: Wanzhu Zhao 00:00 ...
2 views
2027年カレンダーをプレゼント中! スタッフ&キャストの2027年カレンダー(PDF・A4/A3対応)を、 チャンネル登録と「 ...
12 views
1d ago
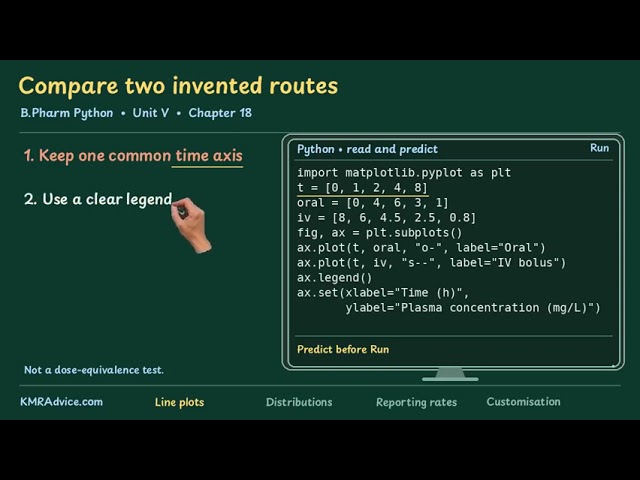
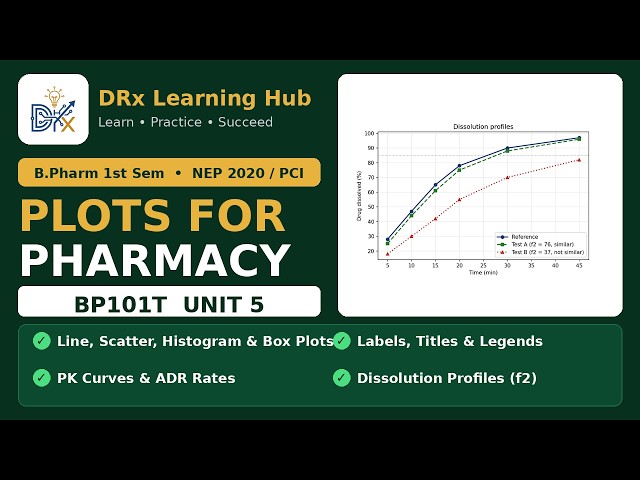
A beginner-friendly B.Pharm Python lesson. Work through familiar problems by hand, then follow the Python code and practise ...
1 view
3d ago
13 views
Python Data Visualization Part 1 | Matplotlib Tutorial for Beginners | Day 19** Welcome to **Day 19 of the Python Tutorial Series!
5 views
Learn Data Visualization with Matplotlib in Python for B.Pharm — line plots, scatter plots, histograms, bar charts and box plots, ...
8 views
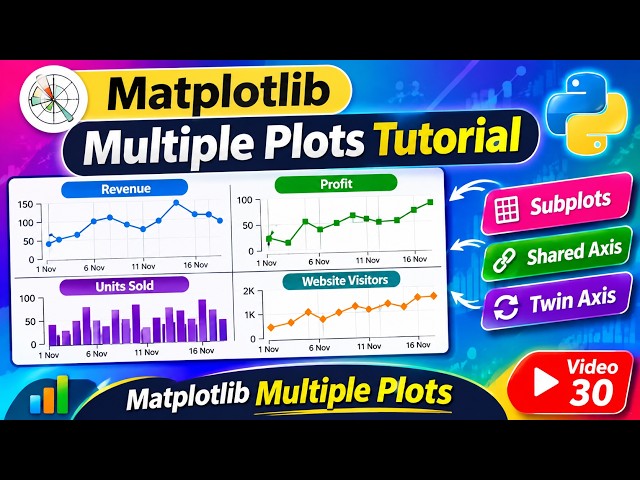
Description এই ভিডিওতে Python Matplotlib ব্যবহার করে Multiple Plots তৈরি করা শিখব। আলোচনা ...
15 views
Part 2 of AI for COVID-19: the neuron (dendrites receive input), summation of inputs and activation functions (sigmoid, hyperbolic ...
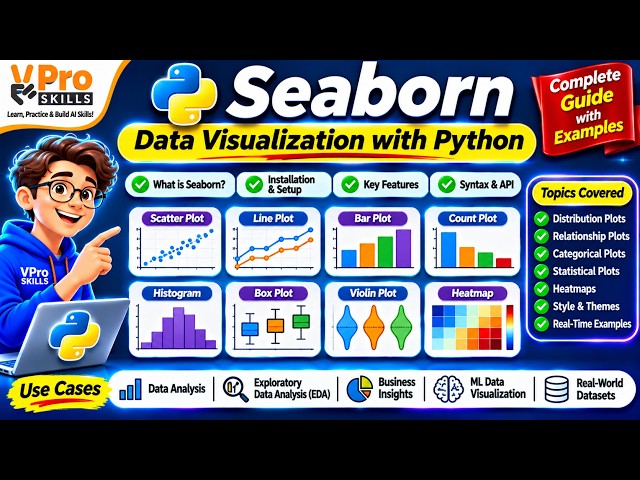
Short Description:** Learn Seaborn, a powerful Python library for statistical data visualization. Understand how to create attractive ...
48 views
Lecture 2 of the medical imaging series: reopening the Pandas notebook, handling missing values column wise, applying ...
14 views