ViewTube

ViewTube
Sign inSign upSubscriptions
Filters

Upload date

Type

Duration

Sort by

Features

Reset

187 results

Jeremy Howard
Creating servers, sending email, visualization/animation, and tensor algebra — Solveit lesson 8

Showcase links shared: - https://share.solve.it.com/d/b5ffb932b1de62f991e22b44b8df3f40 ...

2:30:47
Creating servers, sending email, visualization/animation, and tensor algebra — Solveit lesson 8

2,685 views

Streamed 11mo ago

Neural Casts
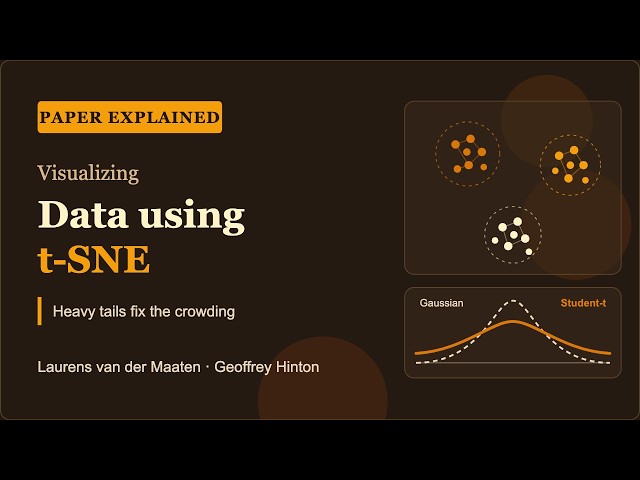
Visualizing Data using t-SNE — Laurens van der Maaten and Geoffrey Hinton

Visualizing Data using t-SNE by Laurens van der Maaten and Geoffrey Hinton Watch the concise version: ...

1:10:12
Visualizing Data using t-SNE — Laurens van der Maaten and Geoffrey Hinton

22 views

5d ago

KAUST Visualization Core Lab
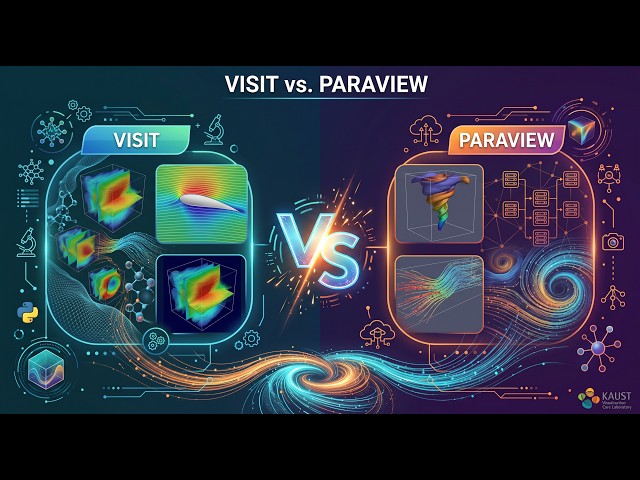
Scientific Visualization 101: Visit vs. ParaView

Overview* Visualization experts James Kress and Thomas Theussl will lead this comparative introduction to the two most popular ...

2:36:15
Scientific Visualization 101: Visit vs. ParaView

229 views

Streamed 8d ago

Displayr
Build Your Dream Visualization: How to make reusable charts with AI

Every researcher knows these two problems. 1. Your software won't make the visualization in your head. So you compromise.

46:32
Build Your Dream Visualization: How to make reusable charts with AI

75 views

7d ago

Vital Skills
Lecture 5.2: Advanced Data Visualization | Full Course: Data Science & Analytics

In this lesson, build on visualization fundamentals by exploring advanced ways to present complex datasets and relationships.

31:31
Lecture 5.2: Advanced Data Visualization | Full Course: Data Science & Analytics

3 views

5d ago

VPro Skills
Matplotlib in Python | Line Plot & Bar Chart | Data Visualization with Practical Examples

Short Description:** Learn Data Visualization using Matplotlib in Python with practical coding examples. Understand how to create ...

52:23
Matplotlib in Python | Line Plot & Bar Chart | Data Visualization with Practical Examples

86 views

6d ago

Hausdorff Center for Mathematics
Jürgen Jost: IsUMap: An improved method for data visualization and dimension reduction.

When data are sampled from some underlying geometric structure, one usually wants not only to recover that structure from nite ...

52:44
Jürgen Jost: IsUMap: An improved method for data visualization and dimension reduction.

54 views

1d ago

Simplilearn
Machine Learning Using Python Full Course 2026 | Learn ML Algorithms & Projects | Simplilearn

" Microsoft Applied Agentic AI: Systems Design & Impact ...

6:18:51
Machine Learning Using Python Full Course 2026 | Learn ML Algorithms & Projects | Simplilearn

9,998 views

Streamed 4d ago

Bioinformatics DotCa
High-Throughput Genomics 2026 | 02: Genome Visualization

Canadian Bioinformatics Workshop series: - High-Throughput Genomics - Genome Visualization (Dr. Erin Pleasance) - Day 1, ...

54:38
High-Throughput Genomics 2026 | 02: Genome Visualization

116 views

4d ago

Alexander Pacha
Applied Deep Learning 2026 - Lecture 8 - Preprocessing, Augmentation, Regularization, Visualization

In this lecture, we're discussing how preprocessing can help our networks to learn better or even enable efficient processing in the ...

1:05:54
Applied Deep Learning 2026 - Lecture 8 - Preprocessing, Augmentation, Regularization, Visualization

161 views

2d ago

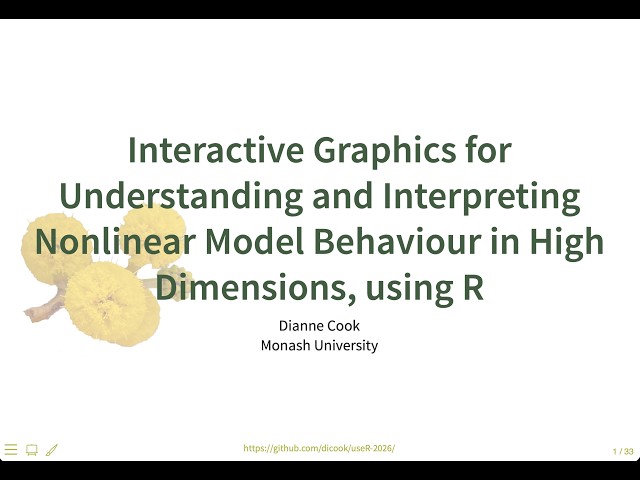
Data Graphics with Di Cook
Interactive Graphics for Understanding and Interpreting Nonlinear Model Behaviour in High Dimensions

This is a recording of my keynote from useR! 2026. The talk argues that we should look at the data and the fitted model, not just ...

44:45
Interactive Graphics for Understanding and Interpreting Nonlinear Model Behaviour in High Dimensions

5 views

6d ago

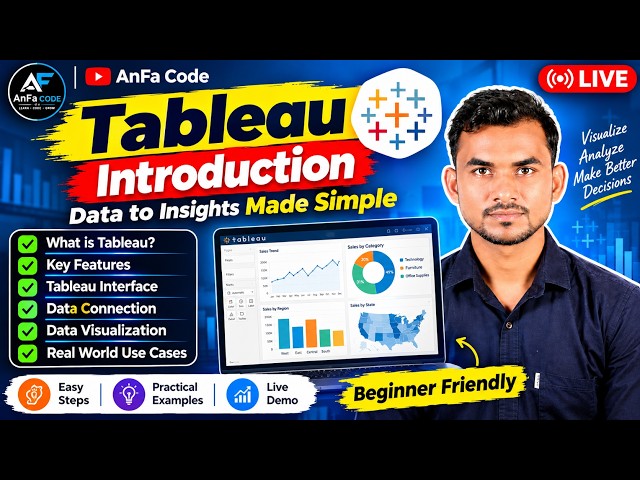
Anfa Code
Introduction Of Tableau For Data Analysis

In this video: In this video, we will learn Tableau with simple explanation and practical examples. Welcome to ANFA CODE ...

33:13
Introduction Of Tableau For Data Analysis

107 views

Streamed 1d ago

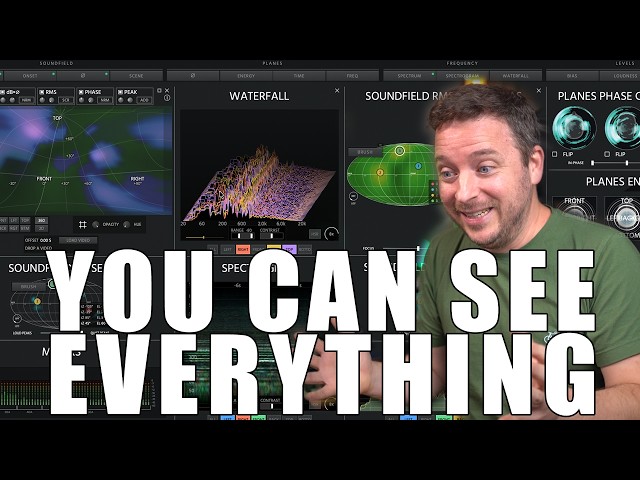
Audio Brewers
The Ultimate Ambisonics Visualiser - Full Walkthrough

Discover "ab Advanced Visualiser HOA Pro", our most advanced Ambisonics visualiser for immersive audio mixing, spatial audio ...

54:51
The Ultimate Ambisonics Visualiser - Full Walkthrough

672 views

1d ago

SORT GAMES SHORTS
From Cocktail Sort to Timsort: An Hour of Calm Sorting for Sleep, No Talking

An hour of sorting algorithms, slowed down to a calm pace. Every bar is a number; every note is one step of the algorithm, pitched ...

1:01:07
From Cocktail Sort to Timsort: An Hour of Calm Sorting for Sleep, No Talking

5 views

6d ago

Mathew K Analytics
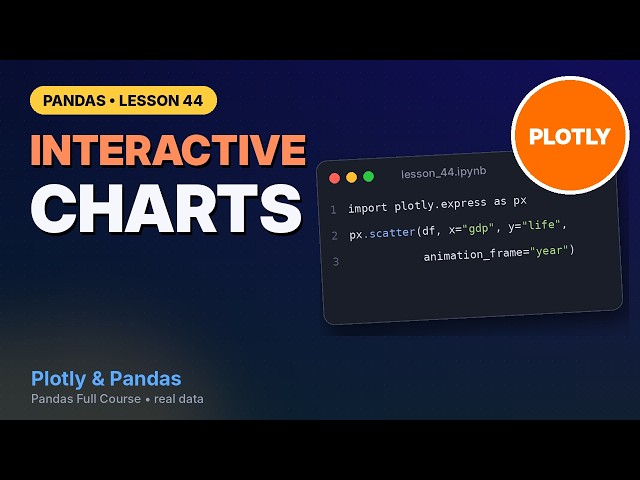
Interactive Charts with Plotly and Pandas (Hover, Animate, Share) | Pandas Course #44

Between 1952 and 2007, which parts of the world caught up on life expectancy, and which fell behind? Static charts can answer ...

24:23
Interactive Charts with Plotly and Pandas (Hover, Animate, Share) | Pandas Course #44

32 views

3d ago

Salek Data Lab
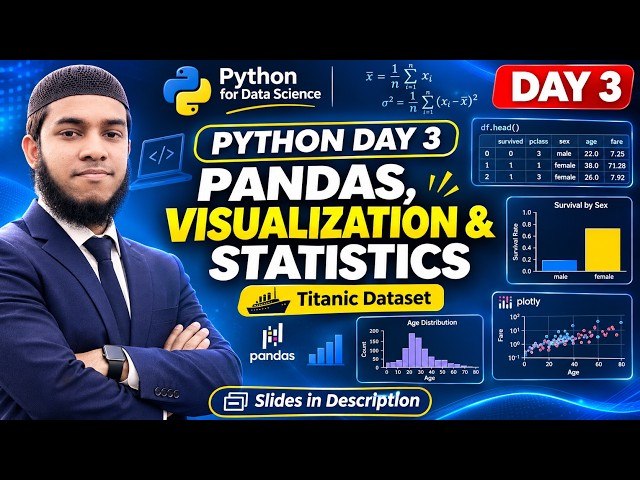
Python for Data Science — Class 03 | Data Cleaning, Visualization & Statistics

Python for Data Science — Class 03 | Data Cleaning, Visualization & Statistics **Salek Data Lab** In this class, we explore ...

43:04
Python for Data Science — Class 03 | Data Cleaning, Visualization & Statistics

40 views

3d ago

Dr. Abhishek Thakur School
PART 2: AI for COVID-19 Data Visualization with Neural Network Basics and Matplotlib

Part 2 of AI for COVID-19: the neuron (dendrites receive input), summation of inputs and activation functions (sigmoid, hyperbolic ...

27:20
PART 2: AI for COVID-19 Data Visualization with Neural Network Basics and Matplotlib

8 views

4d ago

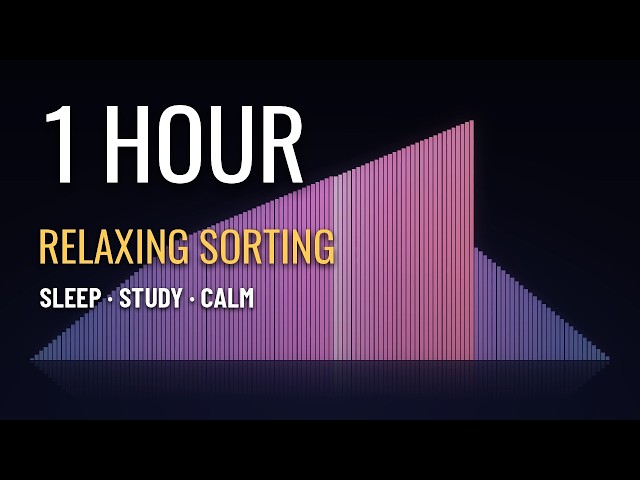
SORT GAMES SHORTS
Relaxing Sorting Algorithms: 1 Hour to Study, Focus or Fall Asleep

An hour of sorting algorithms, slowed down to a calm pace. Every bar is a number; every note is one step of the algorithm, pitched ...

1:00:32
Relaxing Sorting Algorithms: 1 Hour to Study, Focus or Fall Asleep

15 views

7d ago

Maunash Jani
AI Tools for Research

AI tools transforming academic and scientific research in 2026 - from semantic discovery and citation mapping to prompt ...

22:14
AI Tools for Research

73 views

6d ago

Jeremy Howard
SIWC Lesson 6

00:00:00 - Introduction and new features 00:01:35 - Dialogues as Modules and Utils 00:06:18 - Artifacts and Reusability 00:08:31 ...

1:42:05
SIWC Lesson 6

2,869 views

Streamed 1y ago