ViewTube

ViewTube
Sign inSign upSubscriptions
Filters

Upload date

Type

Duration

Sort by

Features

Reset

22,379 results

CppCon
Real-Time Control, Simulation, and Visualization in C++23 With CUDA and Unreal Engine - Kevin Gomez

https://cppcon.org​ --- Real-Time Control, Simulation, and Visualization in C++23 With CUDA and Unreal Engine - Kevin Gomez ...

1:06:58
Real-Time Control, Simulation, and Visualization in C++23 With CUDA and Unreal Engine - Kevin Gomez

6,777 views

2d ago

Open Geospatial Solutions
Intro to GIS Programming | Week 13: Data Visualization with Leafmap

Couse website: https://gispro-fall26.gishub.org --------------------------------------------------------- More Resources: Get My Books on ...

34:30
Intro to GIS Programming | Week 13: Data Visualization with Leafmap

1,341 views

7d ago

HyperFocus777
THE BILLIONAIRE CODE 2027 💲 1111Hz Wealth Visualization | Financial Dominance

THE BILLIONAIRE CODE 2027 💲 1111Hz Wealth Visualization | Financial Dominance 🚀 FOCUS YOUR MIND. BUILD YOUR EMPIRE ...

1:02:27
THE BILLIONAIRE CODE 2027 💲 1111Hz Wealth Visualization | Financial Dominance

1,726 views

22h ago

Jan Marshal
I Built My Own Software Factory with Claude Code

Most of us still babysit our AI coding agents. Every prompt, every file, every test goes through us. So I built a software factory ...

44:09
I Built My Own Software Factory with Claude Code

26,982 views

2w ago

ACM SIGPLAN
[REBASE'26] A Compiler And Visualizer Design For Debugger Visualization Expressions

A Compiler And Visualizer Design For Debugger Visualization Expressions (Video, REBASE 2026) Ryan Fleury (unaffiliated) ...

40:11
[REBASE'26] A Compiler And Visualizer Design For Debugger Visualization Expressions

3,544 views

1d ago

Jeremy Howard
Creating servers, sending email, visualization/animation, and tensor algebra — Solveit lesson 8

Showcase links shared: - https://share.solve.it.com/d/b5ffb932b1de62f991e22b44b8df3f40 ...

2:30:47
Creating servers, sending email, visualization/animation, and tensor algebra — Solveit lesson 8

2,685 views

Streamed 11mo ago

CodewithKiwi
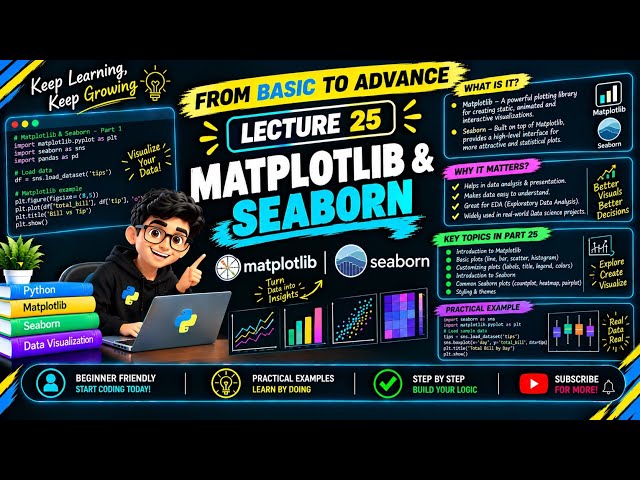
Python Full Course ♥️ | Matplotlib & seaborn | Lecture 25

Matplotlib & Seaborn in Python | Python From Basic to Advanced | CodeWithKiwi Welcome to CodeWithKiwi! In this lesson ...

1:15:45
Python Full Course ♥️ | Matplotlib & seaborn | Lecture 25

25 views

3w ago

Code AI with Ash Naiku
04cd. Visualizing FashionMNIST Like a Pro: PyTorch Dataset Exploration

04c. Feedforward Neural Network (MLP) with PyTorch - FashionMNIST Dataset Visualization, 04d. Feedforward Neural Network ...

38:36
04cd. Visualizing FashionMNIST Like a Pro: PyTorch Dataset Exploration

9 views

3w ago

Inner Reality Mastery
No Belief Required: How I Finally Cracked the Code on Neville Goddard's Visualization Technique

DESCRIPTION Explore Neville Goddard's visualization technique through one brief scene that implies your desire has already ...

48:23
No Belief Required: How I Finally Cracked the Code on Neville Goddard's Visualization Technique

147 views

2w ago

Neuron UCI
Interactive DataFrame Visualisation with Plotly | ISOM5650 2.5

Create readable Plotly figures from DataFrames. Explain axes, units and trace encodings, then demonstrate legends, 3D rotation ...

21:01
Interactive DataFrame Visualisation with Plotly | ISOM5650 2.5

43 views

4w ago

JM Flannery
The Visualization Code: Living in the End — Why Visualization Usually Fails

Most people treat visualization like daydreaming—watching a movie of what they want from the outside looking in. When you ...

30:13
The Visualization Code: Living in the End — Why Visualization Usually Fails

8 views

2d ago

Steve Learning
Building 8 Websites Using Python: Graph Plotting Website (Flask & Matplotlib Tutorial)

Description: Ready to visualize data on the web using Python? In this step-by-step tutorial, we continue our series on building 8 ...

29:06
Building 8 Websites Using Python: Graph Plotting Website (Flask & Matplotlib Tutorial)

80 views

6d ago

Mikey No Code
How I Make AI Apps Look 10x Better with Claude Design + Base44

Claim your FREE $499 Masterclass: Build & Sell Apps, AI Agents & Websites with AI https://mikeyno-code.com/Skool-base44 ...

30:31
How I Make AI Apps Look 10x Better with Claude Design + Base44

28,592 views

2d ago

adrian m.n.
Graph visualization in the browser with D3.js | Building smollerGraph

We give smollerGraph a UI of its own, after its code gets checked on each push by cpplint, against Google's style guide, and by ...

49:22
Graph visualization in the browser with D3.js | Building smollerGraph

20 views

3w ago

Riffomonas Project
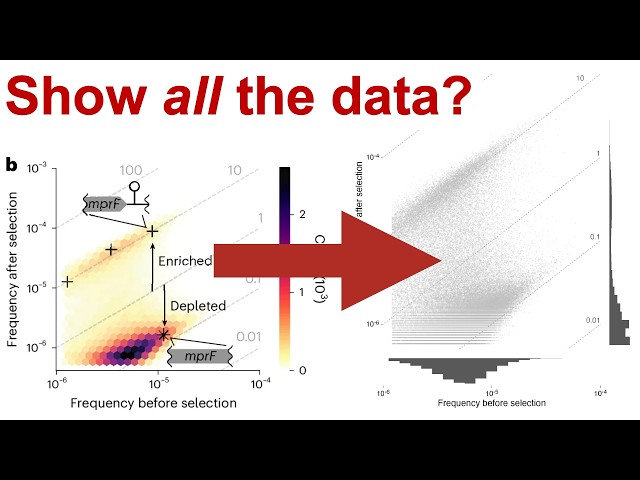
Recreating figures with a lot of data points with R's tidyverse (CC433)

The article discussed: https://www.nature.com/articles/s41564-026-02404-5 Code from this livestream: ...

1:39:45
Recreating figures with a lot of data points with R's tidyverse (CC433)

1,581 views

Streamed 13d ago

SoftwarePlaza
How CodeScene uses CodeHealth Metrics to stop AI Agents from degrading code

Markus Borg, Principal Researcher at CodeScene, joins us to discuss why AI coding agents struggle when pointed at complex ...

49:19
How CodeScene uses CodeHealth Metrics to stop AI Agents from degrading code

82 views

3w ago

Displayr
Build Your Dream Visualization: How to make reusable charts with AI

Every researcher knows these two problems. 1. Your software won't make the visualization in your head. So you compromise.

46:32
Build Your Dream Visualization: How to make reusable charts with AI

75 views

7d ago

MindCraft
I Finally Cracked The Code Of Visualization → A-Z Masterclass On Visualization (Neville Goddard)

If you want to take 1:1 session with me or you want to customize your own personal subliminal/supraliminal you can contact us ...

25:12
I Finally Cracked The Code Of Visualization → A-Z Masterclass On Visualization (Neville Goddard)

14,811 views

9d ago

VPro Skills
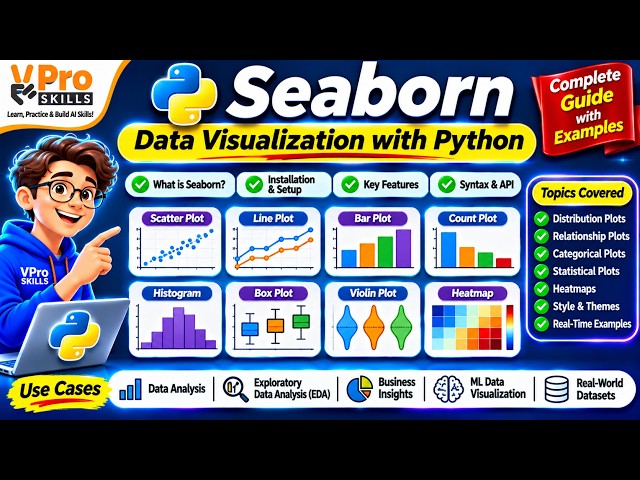
Seaborn in Python | Data Visualization, Statistical Plots & Heatmaps | Practical Examples

Short Description:** Learn Seaborn, a powerful Python library for statistical data visualization. Understand how to create attractive ...

59:51
Seaborn in Python | Data Visualization, Statistical Plots & Heatmaps | Practical Examples

44 views

4d ago

The AML Strategist
Claude Code for Data Analysts: Clean, Analyze & Visualize Data with AI (Beginner Course) #claudecode

Want to use AI to clean, analyze, and visualize data faster?** Discover how Claude Code can transform your data analytics ...

52:20
Claude Code for Data Analysts: Clean, Analyze & Visualize Data with AI (Beginner Course) #claudecode

132 views

3w ago