ViewTube

ViewTube
Sign inSign upSubscriptions
Filters

Upload date

Type

Duration

Sort by

Features

Reset

89,856 results

DataCamp
AI-Powered Data Analysis with Excel & Claude

In this code-along webinar, David Benaim, a Data Visualization Consultant at Xlconsulting Asia, will show you how to use Claude ...

1:04:45
AI-Powered Data Analysis with Excel & Claude

3,500 views

Streamed 9h ago

Simplilearn
Data Analyst Full Course 2027 in 24 Hours | Learn Data Analytics Full Course 2026  Simplilearn

The course also covers statistics, data visualization, dashboard building, and AI-powered analytics so you can turn raw data into ...

23:25:31
Data Analyst Full Course 2027 in 24 Hours | Learn Data Analytics Full Course 2026 Simplilearn

5,150 views

12h ago

Excel Visual
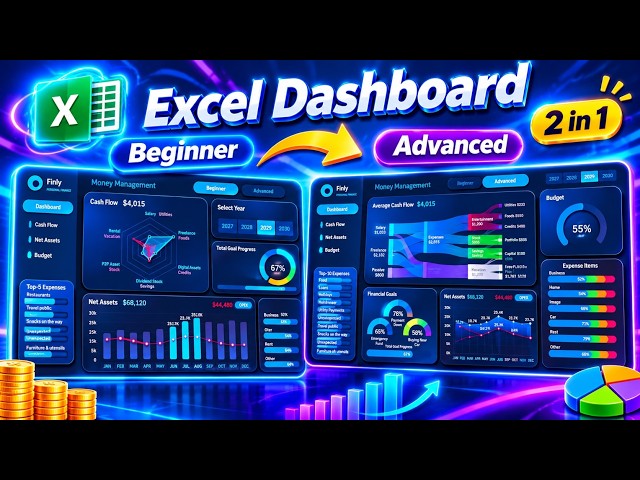
How to Build an Excel Dashboard for Managing Personal Finances Beginner to Advanced

... for Managing Personal Finances Stress-Free • Go from Beginner to Advanced in Excel data visualization • See the real process ...

3:07:43
How to Build an Excel Dashboard for Managing Personal Finances Beginner to Advanced

763 views

1d ago

Intellipaat
Exploratory Data Analysis in Python | Learn EDA with a Real Dataset | Part 1

In this video, we'll explore a real-world Food Delivery dataset using Python, Pandas, NumPy, and data visualization libraries.

53:22
Exploratory Data Analysis in Python | Learn EDA with a Real Dataset | Part 1

5,126 views

13h ago

McGill Libraries
What's wrong with this picture? Fake news and data visualization

A picture is worth a thousand words... but are any of them true? Charts, graphs, and infographics can make information look clear, ...

48:00
What's wrong with this picture? Fake news and data visualization

37 views

6d ago

CppCon
Connecting Firmware to Unreal Engine with CUDA C++

https://cppcon.org​ --- Real-Time Control, Simulation, and Visualization in C++23 With CUDA and Unreal Engine - Kevin Gomez ...

1:06:58
Connecting Firmware to Unreal Engine with CUDA C++

7,050 views

2d ago

Tpoint Tech
Learn Matplotlib in 40 Minutes 🚀 | Python Charts & Graphs Full Course

Enquiry: https://forms.gle/dhZhETccxuQTCBQB9 Learn Matplotlib in Python from scratch with this complete beginner-friendly ...

40:36
Learn Matplotlib in 40 Minutes 🚀 | Python Charts & Graphs Full Course

63 views

14h ago

MySkill
Short Class Data Visualization with Microsoft Excel | MySkill

Halo Bestie✨ Yuk, simak materi "Data Visualization with Microsoft Excel" dari tutor berpengalaman di Short Class Microsoft Excel ...

1:54:13
Short Class Data Visualization with Microsoft Excel | MySkill

3,523 views

Streamed 1d ago

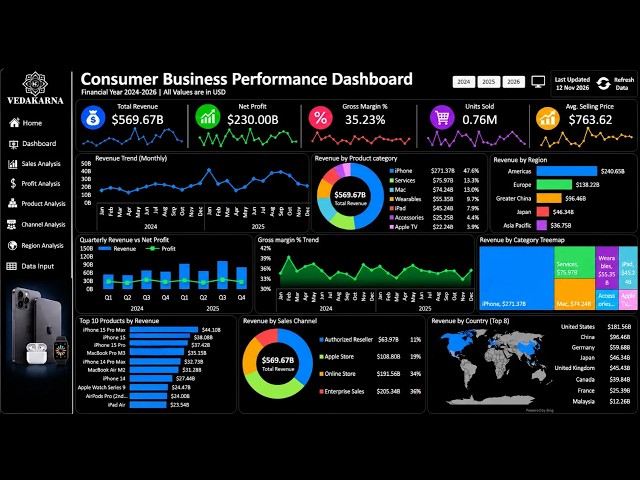
Vedakarna
Create a Interactive Consumer Performance Dashboard in Excel | Beginner to Pro

Free Dashboard: https://vedakarna.com/templates WhatsApp: https://whatsapp.com/channel/0029VbCIu9XHVvTSpnBDWr0e ...

21:52
Create a Interactive Consumer Performance Dashboard in Excel | Beginner to Pro

4,190 views

5d ago

Magnet Brains
Module 5 & 6: Advanced DAX | Power BI, Business Intelligence & Data Visualization | Data Analytics

👉Previous Video: 👉Next Video: ======================================================= ✔️📚👉 Watch Full Free Course Videos ...

21:18
Module 5 & 6: Advanced DAX | Power BI, Business Intelligence & Data Visualization | Data Analytics

4,107 views

1d ago

Arena
GPT-6.2 Astra vs Sol | First Impressions

Peter Gostev compares GPT-6.2 Astra and GPT-6.2 Sol across 3D scenes, games, slides, data visualizations, websites, interactive ...

35:28
GPT-6.2 Astra vs Sol | First Impressions

1,736 views

2h ago

Data Skeptic
Charts You Can Navigate by Ear

Kyle speaks with Jonathan Zong about making data visualizations accessible to blind and low-vision users through screen ...

47:40
Charts You Can Navigate by Ear

58 views

2d ago

MySkill
Short Class Data Visualization with Looker Data Studio | MySkill x Lion Parcel

Hello Bestie✨ Come and check out the "Data Visualization with Looker Data Studio" course from experienced tutors in MySkill's ...

1:55:49
Short Class Data Visualization with Looker Data Studio | MySkill x Lion Parcel

2,020 views

Streamed 7d ago

Vital Skills
Lecture 5.1: Data Visualization | Full Course: Data Science & Analytics

In this lesson, learn how charts and visual representations make data easier to understand. Explore how to select suitable visual ...

20:05
Lecture 5.1: Data Visualization | Full Course: Data Science & Analytics

4 views

5d ago

Vizspire
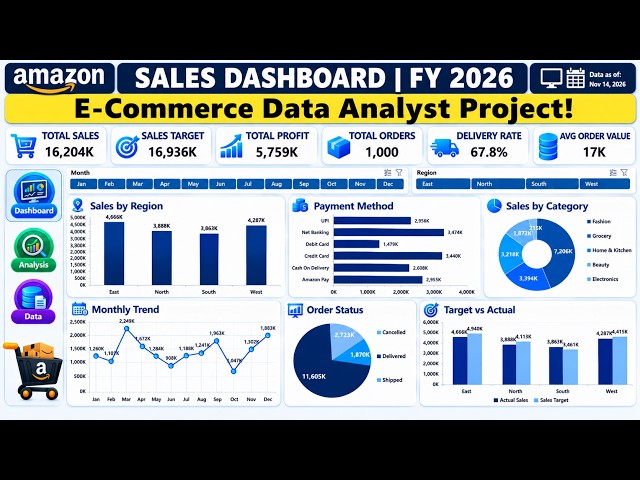
COMPLETE E-Commerce Data Analytics Project | Excel Dashboard | End-to-End Analyst Portfolio Project

... KPI Development Interactive Dashboard Design Business Data Visualization E-Commerce Sales Analysis ⏱️ Video Chapters: ...

22:33
COMPLETE E-Commerce Data Analytics Project | Excel Dashboard | End-to-End Analyst Portfolio Project

1,011 views

4d ago

Computational AI Team
BA05 Lecture Walk Through: Data Visualization in Python

Course: Business Analytics with Python Instructor: Prof. Dr. Dr. Claire Y.T. Chen Teaching Assistant: Wanzhu Zhao 00:00 ...

21:58
BA05 Lecture Walk Through: Data Visualization in Python

2 views

4d ago

Open Geospatial Solutions
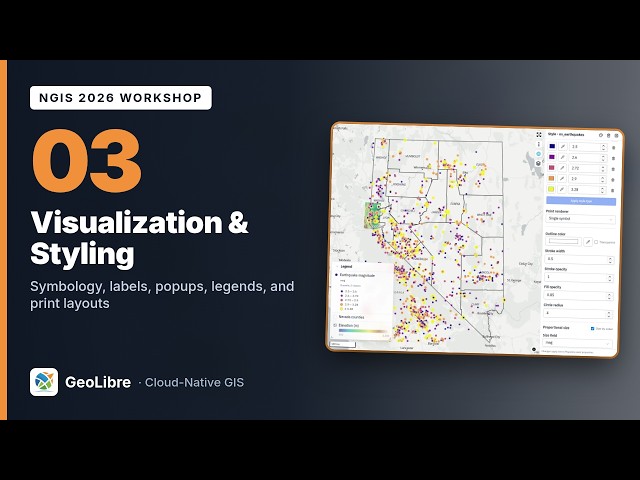
Visualization and Styling: Symbology, Labels, Popups, and Print Layouts | NGIS 2026 Workshop (3/8)

... In Cloud-Hosted Data (2/8) Next: Attributes, Editing, and Spatial SQL (4/8) #GIS #Cartography #DataVisualization #Mapping ...

43:18
Visualization and Styling: Symbology, Labels, Popups, and Print Layouts | NGIS 2026 Workshop (3/8)

316 views

4h ago

Liferay
POINT IT AT AN OBJECT, GET A DASHBOARD WITH A LIFERAY CLIENT EXTENSION | Liferay Devcon 2026 London

... DASHBOARD: SCHEMA-DRIVEN DATA VISUALIZATION — BUILT AS A LIFERAY CLIENT EXTENSION | Liferay Devcon 2026 ...

31:52
POINT IT AT AN OBJECT, GET A DASHBOARD WITH A LIFERAY CLIENT EXTENSION | Liferay Devcon 2026 London

53 views

5d ago

Hausdorff Center for Mathematics
Jürgen Jost: IsUMap: An improved method for data visualization and dimension reduction.

When data are sampled from some underlying geometric structure, one usually wants not only to recover that structure from nite ...

52:44
Jürgen Jost: IsUMap: An improved method for data visualization and dimension reduction.

64 views

1d ago

Steve Learning
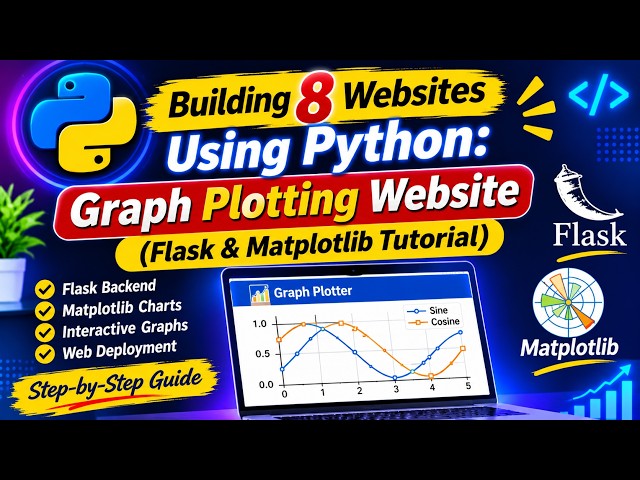
Building 8 Websites Using Python: Graph Plotting Website (Flask & Matplotlib Tutorial)

Whether you are building your developer portfolio, learning data visualization, or expanding your Python web development skills, ...

29:06
Building 8 Websites Using Python: Graph Plotting Website (Flask & Matplotlib Tutorial)

81 views

6d ago