Upload date
All time
Last hour
Today
This week
This month
This year
Type
All
Video
Channel
Playlist
Movie
Duration
Short (< 4 minutes)
Medium (4-20 minutes)
Long (> 20 minutes)
Sort by
Relevance
Rating
View count
Features
HD
Subtitles/CC
Creative Commons
3D
Live
4K
360°
VR180
HDR
659 results
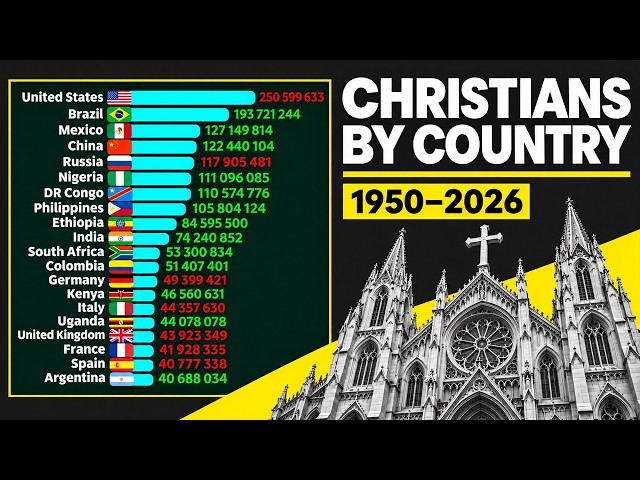
... #ChristianPopulationByCountry #BarChartRace #DataVisualization #ReligiousDemographics #PopulationComparison ...
1,926 views
4h ago
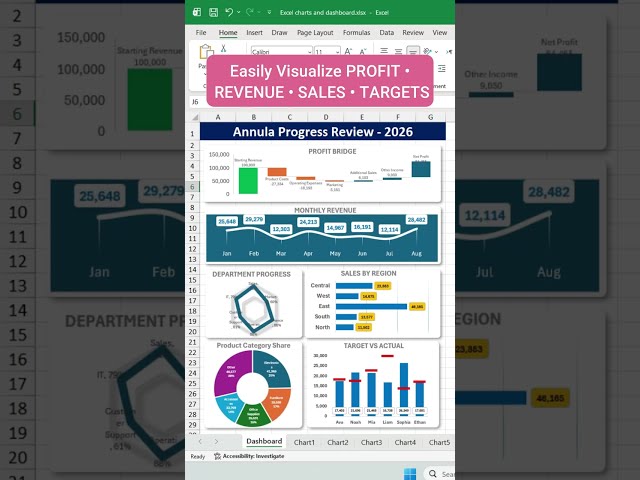
#MicrosoftCopilot #Excel #Microsoft365 #Copilot #DataVisualization Watch related playlists : ✓Popular upload ...
6 views
2h ago
#ExcelDashboard #ExcelCharts #ExcelTutorial #DataVisualization #AnnualPerformance #BusinessDashboard #MicrosoftExcel ...
5 views
Join Mark, Maya, and Dr. Amanda on Research Island as they discover how to turn verified data into clear statistics, charts, and ...
8 views
8h ago
... out my data visualization and storytelling course ➡️ https://www.udemy.com/course/complete-data-visualization-bootcamp/?
20 views
Video credit: NASA's Goddard Space Flight Center Data visualization by: Ernie Wright (STC) Planetary scientist: Noah Petro ...
1,600 views
3h ago
... power bi report tutorial, power query power bi tutorial, dax measures for beginners, power bi data visualization tutorial, power bi ...
112 views
5h ago
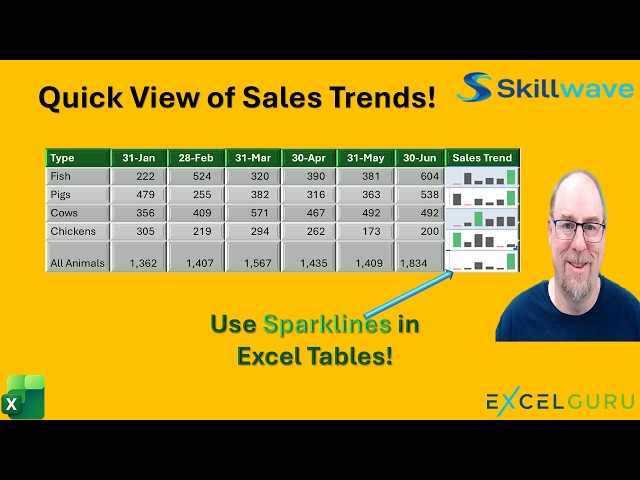
Want a quick way to visualize trends in your Excel data without creating full-sized charts? Try Sparklines! Sparklines are tiny ...
147 views
19h ago
In this talk, he shows you how to use Lonboard for scalable raster data visualization, and discuss how new tools like async-geotiff ...
10 views
12h ago
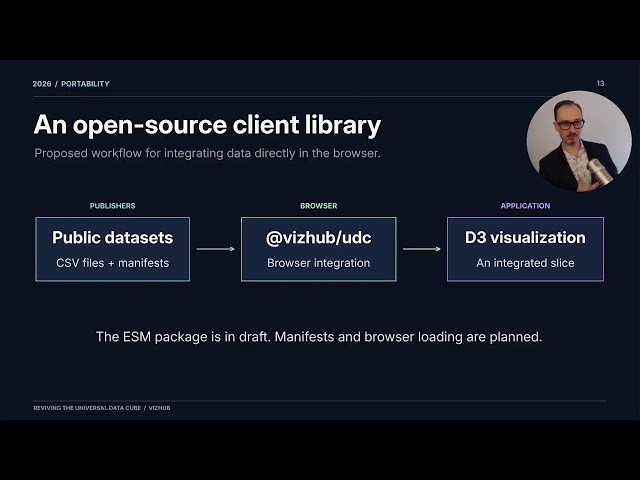
Building a semantic layer for public data visualization.
168 views
23h ago
What You Will Learn: Python Data Visualization Line Chart in Python Stacked Bar Graph Categorical Data Visualization Data ...
1 view
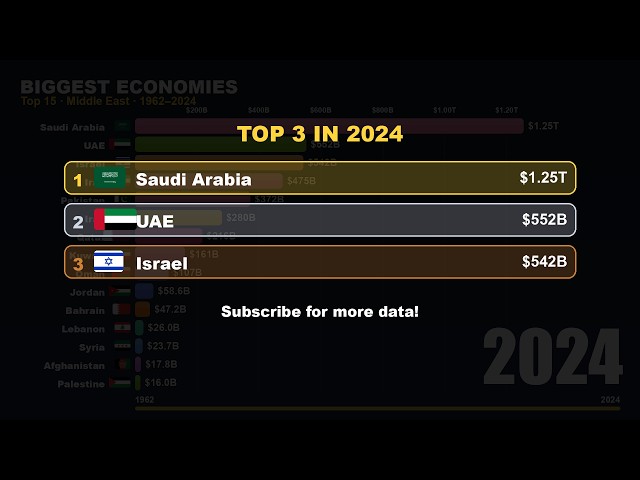
Which country has the biggest economy? A bar chart race of GDP for every region of the world. Chapters: 0:00 World 1960-2025 ...
7h ago
1,286 views
Whether you need to generate data visualization or build a whiteboard for project planning, this breakdown helps you determine if ...
14 views
1h ago
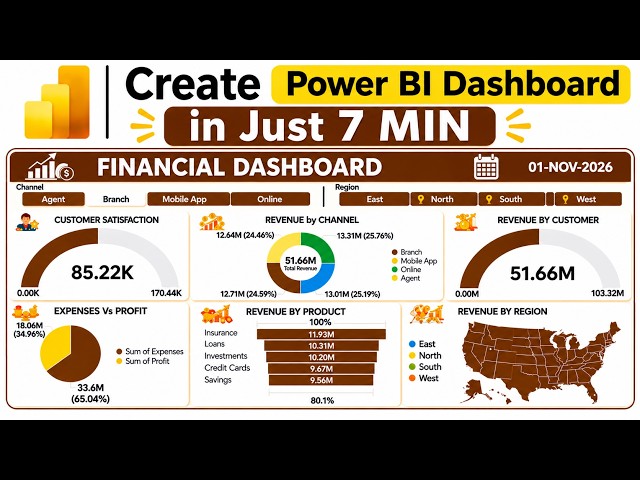
... Interactive Channel Slicer • Professional Financial Dashboard Design • Dynamic Data Visualization WHAT YOU'LL LEARN ...
93 views
10h ago
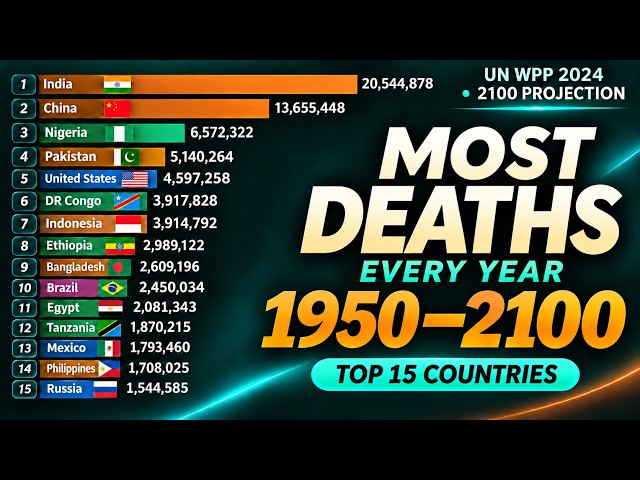
Which countries have the most deaths every year? Explore the Top 15 countries with the highest annual number of deaths from ...
54 views
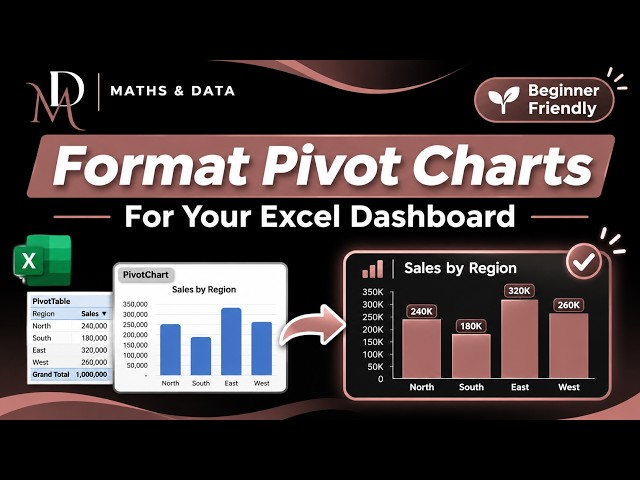
On this channel, we simplify Mathematics, Microsoft Excel, Statistics, Data Analysis, and Data Visualisation through practical, ...
This video is generated by using Gemini Notebook LM based on verified sources. The contents of video have been checked and ...
11h ago
A tour of the main CoastWatch Utilities tools from the perspective of a data user. 00:00 Introduction 01:16 Scientific data access ...
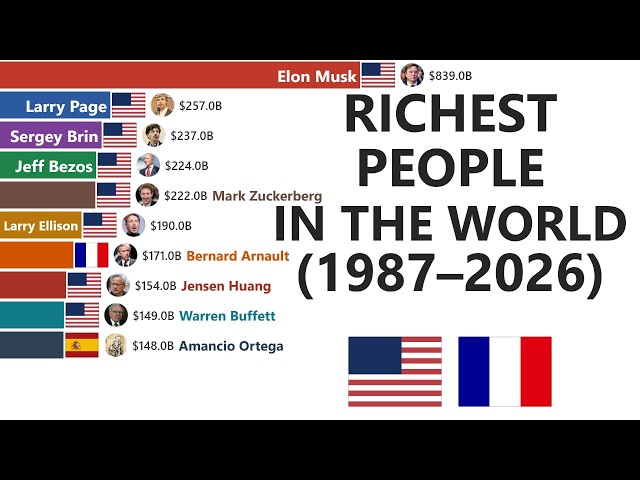
Subscribe for more data races. Music: original, generated for this channel. #barchartrace #billionaires #datavisualization.
0 views
6h ago