ViewTube

ViewTube
Sign inSign upSubscriptions
Filters

Upload date

Type

Duration

Sort by

Features

Reset

103,118 results

Imperial Statistics
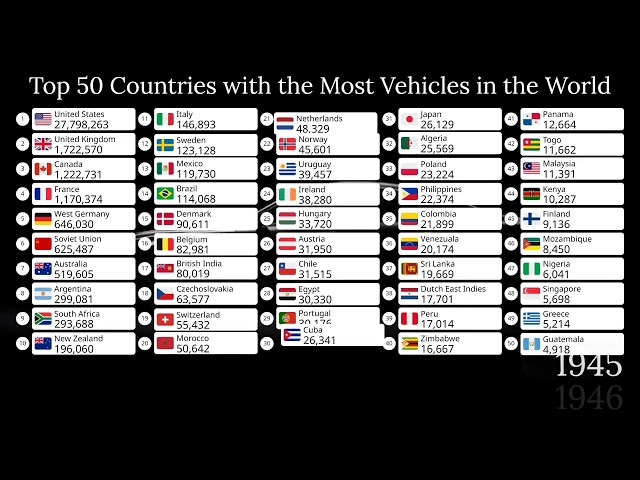
Top 50 Countries with the Most Vehicles in the World (1900-2026)

... automotive history, transportation, geography, economics, country rankings, infrastructure, and historical data visualizations.

10:36
Top 50 Countries with the Most Vehicles in the World (1900-2026)

9,595 views

1d ago

InfoZoom
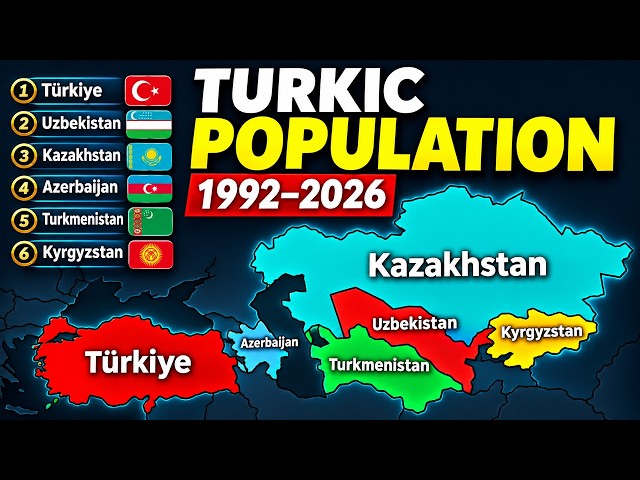
How Turkic Countries’ Populations Changed 1992–2026

... #PopulationComparison #BarChartRace #DataVisualization #Turkey #Uzbekistan #Kazakhstan #Azerbaijan #Turkmenistan ...

8:06
How Turkic Countries’ Populations Changed 1992–2026

23,684 views

2d ago

Daniel Anderson
SharePoint List Data Visualisation Just Got a Big Upgrade (D3.js)

D3.js has landed in the SharePoint sandbox, and Copilot in SharePoint can now use it to build views that tell a story about your ...

7:20
SharePoint List Data Visualisation Just Got a Big Upgrade (D3.js)

3,181 views

1d ago

Shaz Mathew
Build a LIVE Dashboard with Claude in Minutes (Claude Artifacts 2.0)

This tutorial is for anyone looking to improve their data visualization efficiency. We cover the setup process and show how to ...

11:43
Build a LIVE Dashboard with Claude in Minutes (Claude Artifacts 2.0)

4,546 views

1d ago

Microsoft Power BI
Power BI Update - November 2026

Catch up on everything new in Power BI for November 2026. Get a quick rundown of this month's updates, see the new features in ...

19:22
Power BI Update - November 2026

42,764 views

2d ago

Microsoft Fabric
Fabric Update - November 2026

Catch up on everything new in Microsoft Fabric for November 2026. Get a quick rundown of this month's updates and see the new ...

14:30
Fabric Update - November 2026

11,139 views

2d ago

InfoZoom
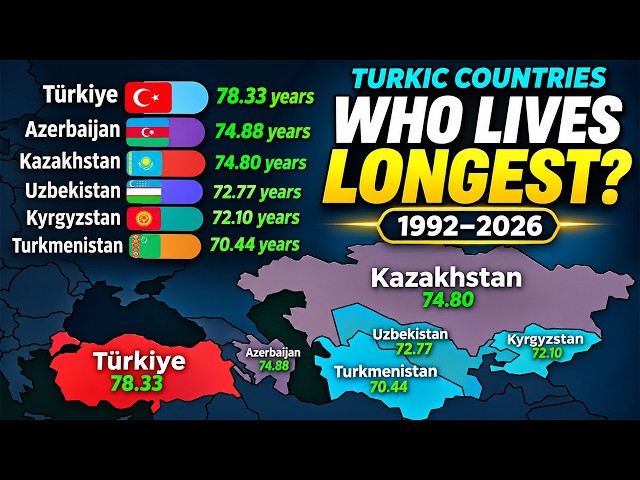
Which Turkic Country Lives the Longest? | 1992–2026

... both sexes combined #LifeExpectancy #TurkicCountries #Longevity #BarChartRace #DataVisualization #CountryComparison ...

8:06
Which Turkic Country Lives the Longest? | 1992–2026

4,146 views

1d ago

InfoZoom
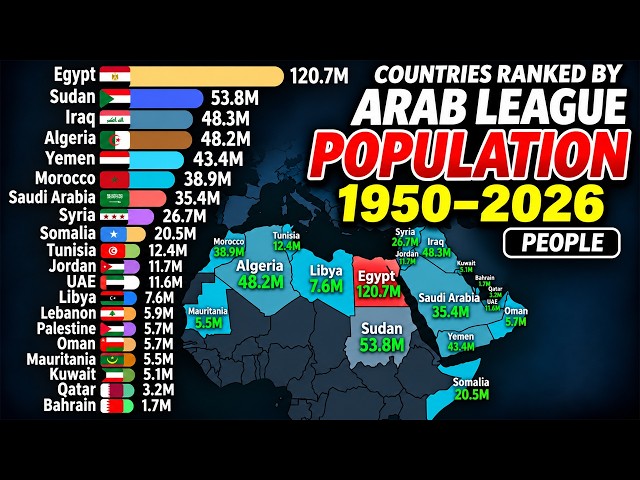
How Arab Countries’ Populations Changed | 1950–2026

... #PopulationComparison #BarChartRace #DataVisualization #Demographics #Geography #Egypt #SaudiArabia #InfoZoom.

8:06
How Arab Countries’ Populations Changed | 1950–2026

2,758 views

13h ago

LearnCoachAssistWatch
Data Visualization in Python: Marks and Channels

Learn data visualization in Python by exploring marks and channels, ranked by accuracy. You will build a dot plot, a text scatter ...

4:33
Data Visualization in Python: Marks and Channels

0 views

6d ago

SACDAP INFO
Data Visualization: Turning Numbers into Insights |

In data science, we often work with large amounts of numerical data. Looking at rows and columns of numbers can make it difficult ...

5:06
Data Visualization: Turning Numbers into Insights |

5 views

3d ago

Damon Cart NLP
Once I understood this about visualization, my life changed

Visualization is more than just imagining what you want. In this video, I share a realization that completely changed how I ...

14:50
Once I understood this about visualization, my life changed

21,486 views

3d ago

principalppgcas principal
Interactive Data Visualization

Interactive Data Visualization refers to the process of representing data through visual elements such as charts, graphs, maps, ...

10:22
Interactive Data Visualization

11 views

6d ago

BELMONT NAVIN.V
Data cleaning and data visualization
4:43
Data cleaning and data visualization

1 view

5d ago

Centre of Best Learnings (CBL)
Create an interactive excel dashboard to track and visualise progress dynamically | full tutorial

... dynamically (full tutorial) #exceldashboard #dynamicdashboard #interactivedashboard #excel #exceltutorial #datavisualization.

11:28
Create an interactive excel dashboard to track and visualise progress dynamically | full tutorial

108 views

6d ago

U.S. Census Bureau
DATA GEM: Navigate the U.S. Economy with the 2024 AIES Interactive Tool

#CensusAcademy #DataGems #DataTools #DataVisualization #datascience #population #dataanalysis #economy #employment ...

4:54
DATA GEM: Navigate the U.S. Economy with the 2024 AIES Interactive Tool

155 views

2d ago

Chronicle Data
MOST Selling Hi-Fi Amplifier Brands OF ALL TIME? (1960–2026) Pioneer vs Sansui vs Marantz

... License: http://creativecommons.org/licenses/by/4.0/ #hifi #vintageaudio #stereo #datavisualization #barchartrace.

10:01
MOST Selling Hi-Fi Amplifier Brands OF ALL TIME? (1960–2026) Pioneer vs Sansui vs Marantz

115,685 views

2d ago

How To Electronics
ESP32 LiDAR Scanner with Benewake NOVA20 Multi-Point Lidar | Live 2D & 3D Visualization

jlcpcb #pcba Order PCB with JLCPCB: https://jlcpcb.com/pcb-assembly?from=XOLOIZHZW NOVA20 ...

12:04
ESP32 LiDAR Scanner with Benewake NOVA20 Multi-Point Lidar | Live 2D & 3D Visualization

315,302 views

3d ago

Frozzenrainbow
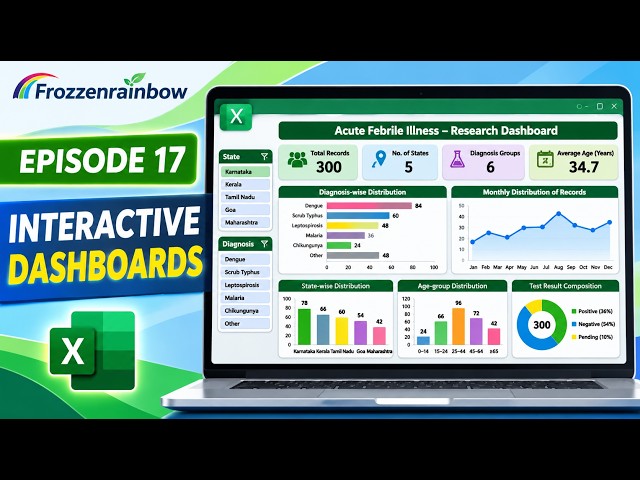
Create an Interactive Dashboard in Excel | Laboratory & Research Data Analysis | Episode 17

... Excel dashboards and data visualisation About this series: This is Episode 17 of the Frozzenrainbow Advanced Excel Series, ...

6:33
Create an Interactive Dashboard in Excel | Laboratory & Research Data Analysis | Episode 17

22 views

5d ago

Jignasa Desai
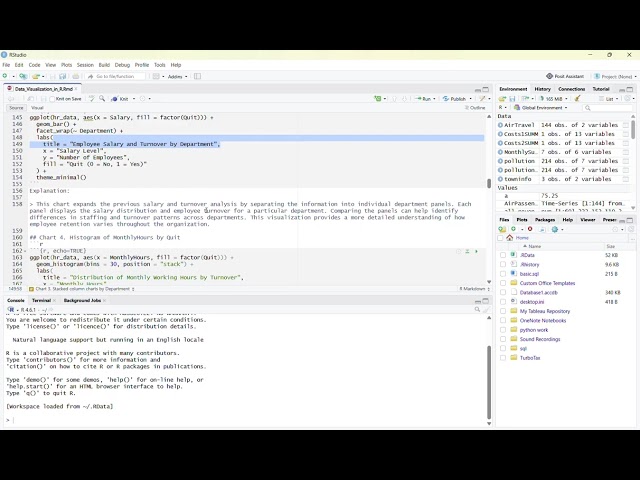
Data Visualization in R
5:43
Data Visualization in R

1 view

4d ago

Frozzenrainbow
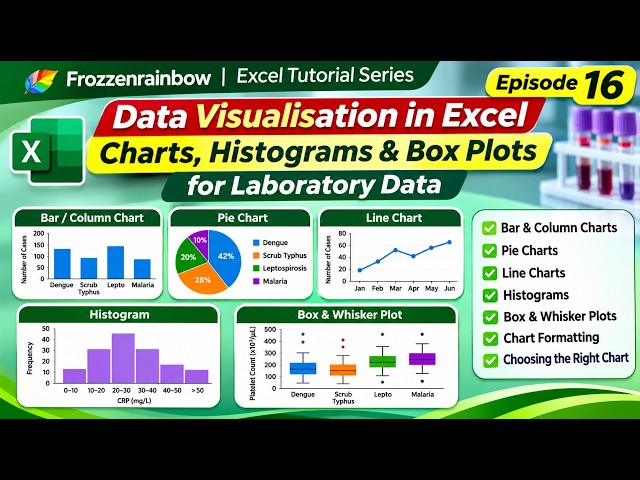
Data Visualisation in Excel | Bar Charts, Pie Charts, Histograms & Box Plots | Episode 16

Welcome to Episode 16 of the Frozzenrainbow Excel Tutorial Series! We are now entering the next phase of our Excel learning ...

6:23
Data Visualisation in Excel | Bar Charts, Pie Charts, Histograms & Box Plots | Episode 16

69 views

6d ago