ViewTube

ViewTube
Sign inSign upSubscriptions
Filters

Upload date

Type

Duration

Sort by

Features

Reset

942,694 results

Gurru Tech Solutions
Nano Banana + Gemini 3: AI Data Visualization That Actually Works

Nano Banana + Gemini 3: The Data Visualization Workflow You Need | Stop Making Boring Charts – Use This Nano Banana + ...

10:14
Nano Banana + Gemini 3: AI Data Visualization That Actually Works

28,296 views

11mo ago

ToThePoint Guide
9 BEST Data Visualization Tools in 2026 in 2026

If you liked this video, you can support me here: https://ko-fi.com/marcusguidesyou or here: https://paypal.me/marcusstoneytb Or if ...

5:45
9 BEST Data Visualization Tools in 2026 in 2026

858 views

8mo ago

BioTech Whisperer
Principles of Effective Visualization in Data Visualization and Scientific Communication (13 Mins)

Welcome today we're diving into the principles of effective visualization a crucial skill in both data visualization and scientific ...

13:05
Principles of Effective Visualization in Data Visualization and Scientific Communication (13 Mins)

125 views

11mo ago

Maven Analytics
9 Essential Chart Types for Data Analysts | Data Visualization 101

48-HOUR BLACK FRIDAY BONUS 50% off Maven Pro Lifetime Plus deals on monthly + annual plans: https://bit.ly/4kvotxf ...

7:14
9 Essential Chart Types for Data Analysts | Data Visualization 101

9,093 views

10mo ago

Bio-Resource
12 Essential Data Visualization Charts Every Life Scientist Must Know | Biotech & Research Guide

Data visualization is not just about making figures look attractive—it is about communicating science accurately and honestly.

14:40
12 Essential Data Visualization Charts Every Life Scientist Must Know | Biotech & Research Guide

267 views

5mo ago

InfoZoom
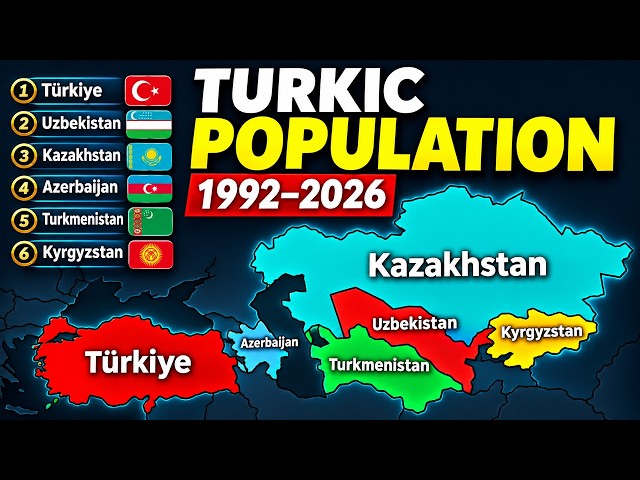
How Turkic Countries’ Populations Changed 1992–2026

... #PopulationComparison #BarChartRace #DataVisualization #Turkey #Uzbekistan #Kazakhstan #Azerbaijan #Turkmenistan ...

8:06
How Turkic Countries’ Populations Changed 1992–2026

23,674 views

2d ago

Daniel Anderson
SharePoint List Data Visualisation Just Got a Big Upgrade (D3.js)

D3.js has landed in the SharePoint sandbox, and Copilot in SharePoint can now use it to build views that tell a story about your ...

7:20
SharePoint List Data Visualisation Just Got a Big Upgrade (D3.js)

3,188 views

1d ago

SP Learning Labs
What Is Data Visualization? | Explained for Beginners with Real-World Examples

What is Data Visualization, and why is it important in Data Science? Imagine having 10 lakh customer records in an Excel sheet.

12:34
What Is Data Visualization? | Explained for Beginners with Real-World Examples

104 views

1mo ago

SP Learning Labs
Data visualization - Matplotlib vs Seaborn vs Plotly | Which Should You Learn First?

Data visualization - Matplotlib vs Seaborn vs Plotly | Which Should You Learn First? we begin one of the most important and ...

5:22
Data visualization - Matplotlib vs Seaborn vs Plotly | Which Should You Learn First?

618 views

6mo ago

UCLA Office of Advanced Research Computing (OARC)
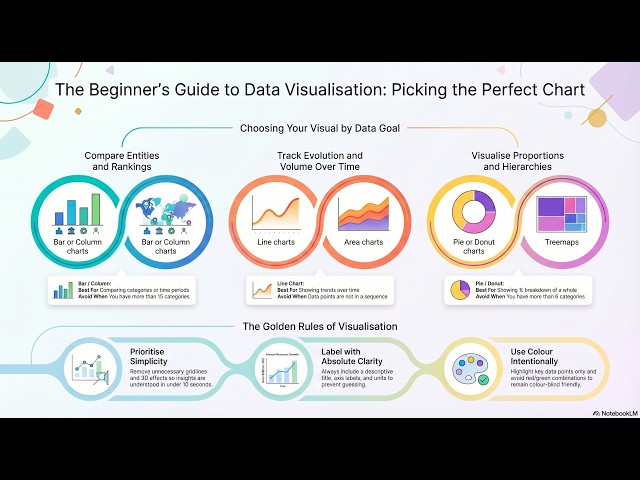
NotebookLM for Research: Data Visualization and Interpretation

NotebookLM for Research May 21, 2026 By Francesca Albrezzi This new OARC Youtube playlist is designed to transform ...

8:05
NotebookLM for Research: Data Visualization and Interpretation

387 views

5mo ago

InfoZoom
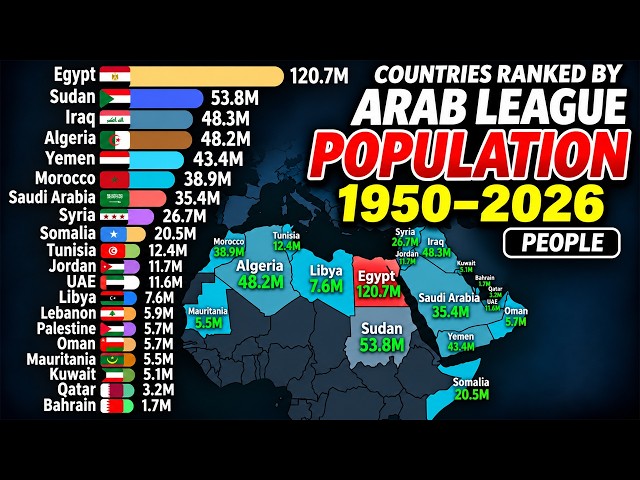
How Arab Countries’ Populations Changed | 1950–2026

... #PopulationComparison #BarChartRace #DataVisualization #Demographics #Geography #Egypt #SaudiArabia #InfoZoom.

8:06
How Arab Countries’ Populations Changed | 1950–2026

2,809 views

14h ago

Microsoft Power BI
Power BI Update - November 2026

Catch up on everything new in Power BI for November 2026. Get a quick rundown of this month's updates, see the new features in ...

19:22
Power BI Update - November 2026

42,853 views

2d ago

answersQ
6 Best Free Data Visualization Courses (Certs Checked)

Six free data visualization courses, checked by hand — and the one thing most "free courses" lists leave out: whether the ...

6:05
6 Best Free Data Visualization Courses (Certs Checked)

779 views

2mo ago

Sowmiya Rengasamy
Visual Encoding  of Data  | Data Visualization | SNS Institutions

snsinstitutions #snsdesignthinkers #designthinking Visual encoding of data refers to the way information is represented visually ...

6:57
Visual Encoding of Data | Data Visualization | SNS Institutions

89 views

11mo ago

Great Learning
Power BI Data Visualization for Beginners: Import Data, Build Charts, Drill Down, Dashboards

Learn how to create visualizations in Power BI from scratch using imported data. We'll walk through multiple ways to build visuals ...

15:06
Power BI Data Visualization for Beginners: Import Data, Build Charts, Drill Down, Dashboards

2,077 views

9mo ago

BrightLearn
Data Visualization Summarized

This video explains data story telling using visuals.

5:18
Data Visualization Summarized

1,112 views

7mo ago

ZAINAB TECH LAB
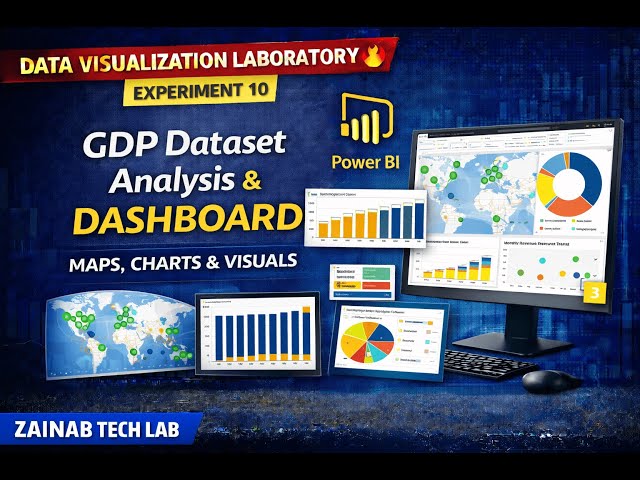
Experiment-10 | Data Visualization Laboratory BAI504 | GDP Dataset Analysis & Dashboard | VTU

In this video, we cover Experiment-10 of Data Visualization Laboratory (BAI504): Analysis of GDP Dataset using Maps, Charts, ...

8:17
Experiment-10 | Data Visualization Laboratory BAI504 | GDP Dataset Analysis & Dashboard | VTU

667 views

10mo ago

Sumit Tripathi
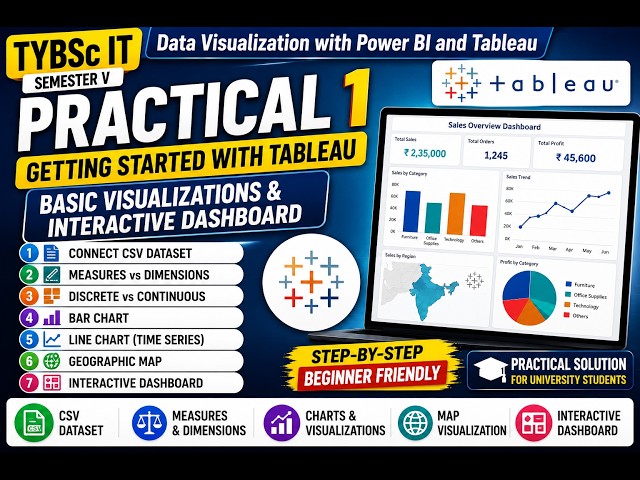
TYBSc IT | Data Visualization with Power BI & Tableau | Practical 1 | Tableau Basics & Dashboard

Practical 1 | Data Visualization with Power BI and Tableau Learn Tableau from scratch by connecting a CSV dataset, ...

8:07
TYBSc IT | Data Visualization with Power BI & Tableau | Practical 1 | Tableau Basics & Dashboard

226 views

3mo ago

Blender
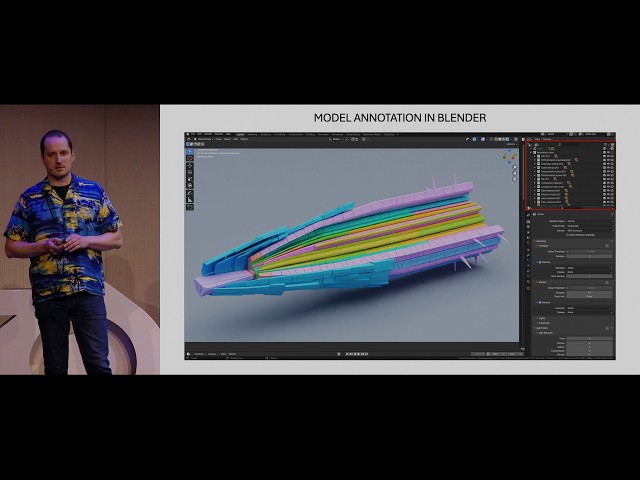
Cella: 3D Data Visualization for Plant Single-Cell Transcriptomics — BCON26

"Cella: 3D Data Visualization for Plant Single-Cell Transcriptomics" by Sampo Muranen at Blender Conference 2026 Recent ...

16:29
Cella: 3D Data Visualization for Plant Single-Cell Transcriptomics — BCON26

1,250 views

1mo ago

FreshSpectrum - Chris Lysy
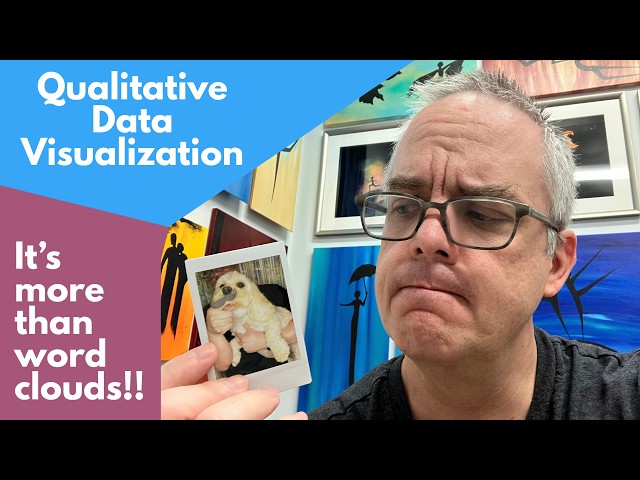
Qualitative Data Visualization 101

A quick guide to qualitative data visualization. Because it's a lot more than word clouds and pie charts. In this short video, I explain ...

5:30
Qualitative Data Visualization 101

180 views

1mo ago