Upload date
All time
Last hour
Today
This week
This month
This year
Type
All
Video
Channel
Playlist
Movie
Duration
Short (< 4 minutes)
Medium (4-20 minutes)
Long (> 20 minutes)
Sort by
Relevance
Rating
View count
Features
HD
Subtitles/CC
Creative Commons
3D
Live
4K
360°
VR180
HDR
13,772 results
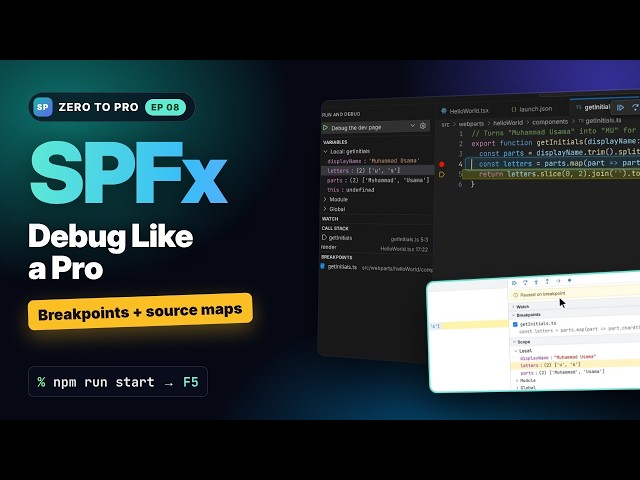
Our web part shows the wrong initials, so we debug it like a pro. In this episode you load local SPFx code on a real SharePoint ...
56 views
3w ago
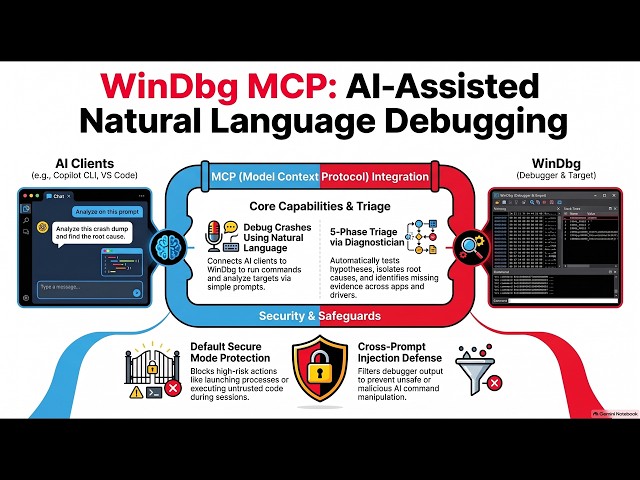
Say goodbye to memorizing complex debugger commands and hello to natural language debugging In this video, we dive ...
97 views
4w ago
Talk to Your Crash Dumps: Debugging a Real-Time Kernel Stall with drgn and AI - Wander Costa, Red Hat Analyzing kernel crash ...
46 views
2w ago
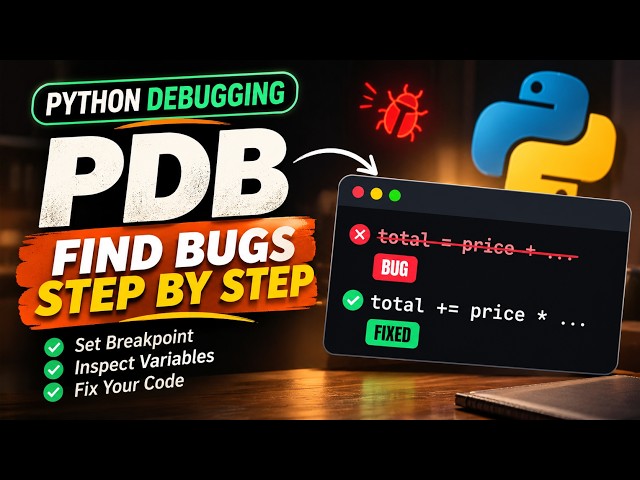
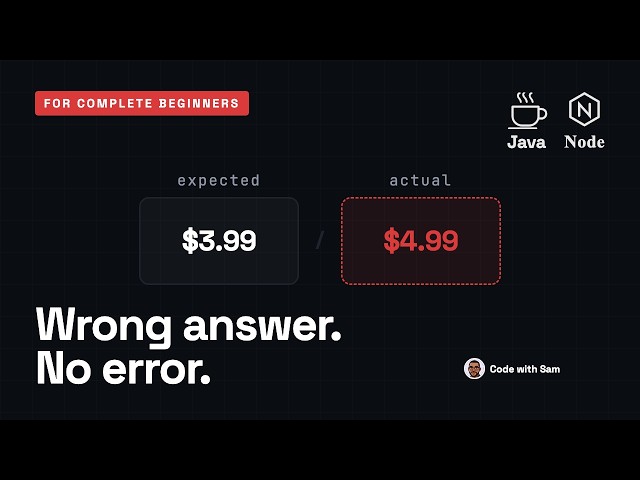
Ever had code that runs with zero errors or red text, but still gives the completely wrong output? Silent logic bugs are the hardest to ...
33 views
11d ago
Your button does nothing when you click it. No error, no crash, just silence — and you have no idea where to start. In this video, I ...
24 views
8d ago
DevTools for agents now provides dedicated memory debugging tools to help identify memory leaks in web applications.
5,766 views
13d ago
Are failing integration tests leaving you staring at Program log: traces and unsure where to start? Learn a repeatable workflow to ...
3 views
This receipt prints $4.99 with no error. It should be $3.99. In this episode we stop the program halfway, look at every value, and ...
12 views
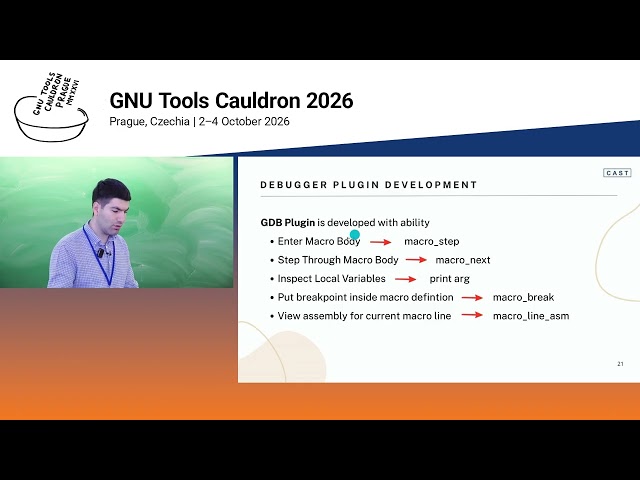
The talk is about debugging C/C++ macros like functions. Currently, GDB treats macro expansions as a single opaque step, ...
189 views
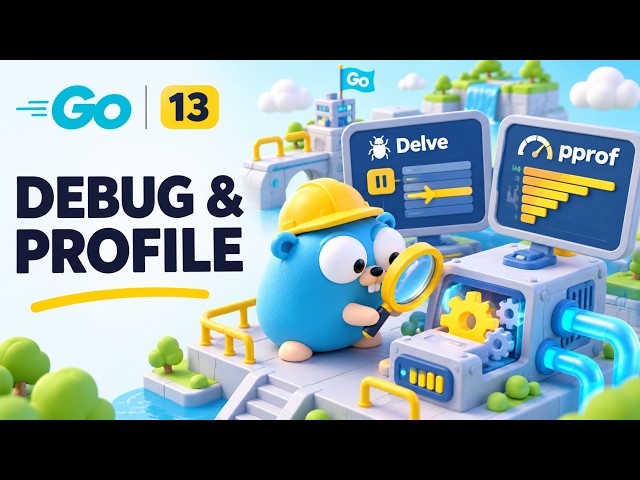
Where does a Go program spend its time and memory, and how do we prove a fix helps? In this video we profile Shrink's server ...
4 views
5d ago
Most developers know VS Code, Docker, GitHub Copilot and Postman. But what about the developer tools that solve the annoying ...
169 views
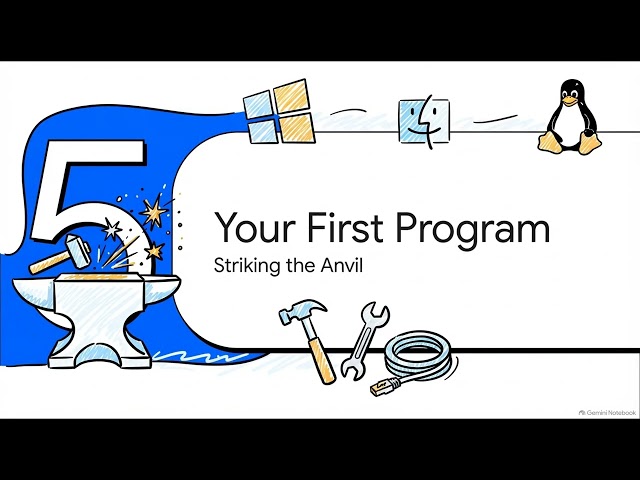
Compilers, linkers, and debuggers. • The software development workflow. • Command-line versus graphical development tools.
26 views
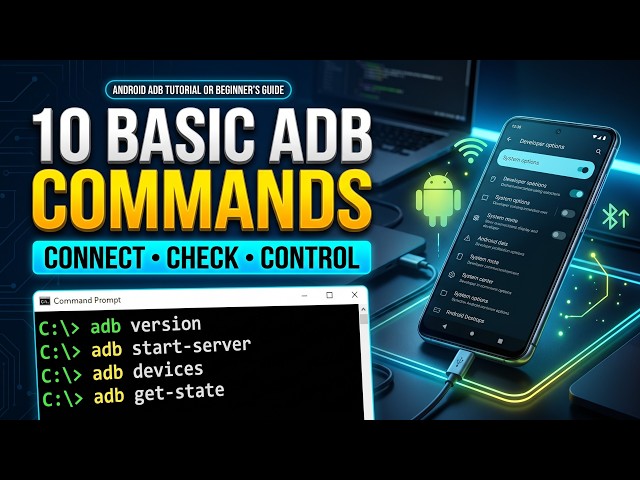
Learn 10 Essential ADB Commands for Android Beginners! Want to connect your Android phone to a computer and control it ...
111 views
Learn how developers use the Chrome DevTools Sources Tab to debug JavaScript and understand how code executes in a web ...
144 views
https://www.google.com/search?q=pixelvalut.com – DNS troubleshooting. Domain not resolving after a change? Here is how to ...
6 views
A complete, zero-fluff engineering masterclass on Debugging React Applications in React. Curriculum overview and deep-dive ...
Try Air in JetBrains IDEs: https://jb.gg/uf1rym Google says about 75% of its new code is AI-generated. Anthropic says more than ...
200,210 views
Learn how to use the **built-in ST-LINK Virtual COM Port (VCP) on STM32 Nucleo boards** to send UART data directly from your ...
126 views
9d ago
BugLenz is a free Chrome extension that shows you why a request failed, lets you replay it, and helps you prove your fix, right ...
28 views
Debugging with ChatGPT | Fenton Lab — Episode 03** Getting errors in your code? Learn how ChatGPT can help you ...
17 views