ViewTube

ViewTube
Sign inSign upSubscriptions
Filters

Upload date

Type

Duration

Sort by

Features

Reset

10,239 results

Mike Tholfsen
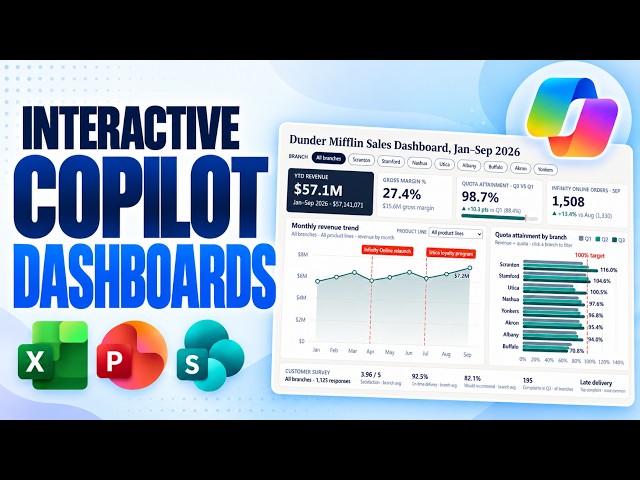
Create Incredible Copilot Dashboards in Excel, PowerPoint & SharePoint

Learn how to create amazing interactive dashboards with new features in Microsoft Copilot in Excel, PowerPoint, and SharePoint.

15:24
Create Incredible Copilot Dashboards in Excel, PowerPoint & SharePoint

75,117 views

2w ago

Zach Rosenfield
SharePoint Like You've Never Seen It Before

What if your SharePoint documents and spreadsheets could tell an animated story instead of sitting behind another static chart?

8:06
SharePoint Like You've Never Seen It Before

4,907 views

2d ago

Data Tutorial
Excel Charts for Beginners: Column, Line, Bar & Pie Charts (Lecture 1.20)

Choose and build the right chart: column charts, chart elements (titles, labels, legend), formatting for clarity, line charts for trends, ...

8:05
Excel Charts for Beginners: Column, Line, Bar & Pie Charts (Lecture 1.20)

35 views

10d ago

TeachExcel
I'm never making Excel charts the same way again after learning this crazy trick

Project Files: https://www.teachexcel.com/excel-tutorial/2742/e?src=yt_zVO8zfVCW9s Excel AI Course (On Sale): ...

14:04
I'm never making Excel charts the same way again after learning this crazy trick

26,685 views

4w ago

Robert Killalea
Build INCREDIBLE Dashboards in Minutes! Claude Dashboards

ClaudeAI #ClaudeDashboards #Dashboards #DataVisualisation #Excel #ExcelTips #AIAutomation #DataAnalytics ...

10:06
Build INCREDIBLE Dashboards in Minutes! Claude Dashboards

1,024 views

3w ago

Frozzenrainbow
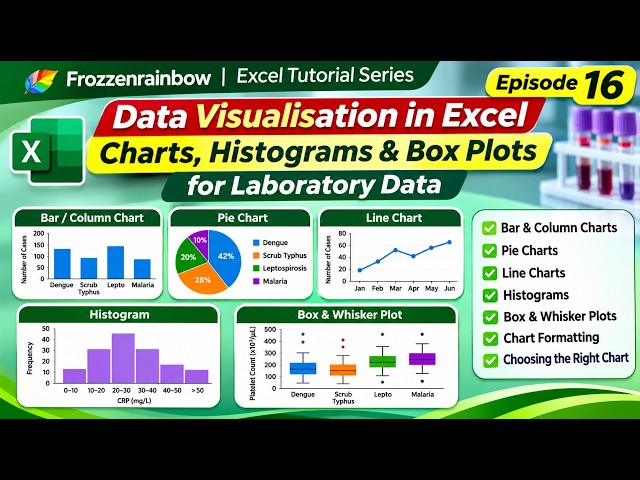
Data Visualisation in Excel | Bar Charts, Pie Charts, Histograms & Box Plots | Episode 16

Welcome to Episode 16 of the Frozzenrainbow Excel Tutorial Series! We are now entering the next phase of our Excel learning ...

6:23
Data Visualisation in Excel | Bar Charts, Pie Charts, Histograms & Box Plots | Episode 16

62 views

5d ago

VizoraLabs
Build an Executive Excel Dashboard in 15 Minutes

Clean it first: Clean Messy Excel Data Automatically (Power Query to Power BI) https://www.youtube.com/watch?v=-K43hzBOAQY ...

13:13
Build an Executive Excel Dashboard in 15 Minutes

85 views

9d ago

Karina Adcock
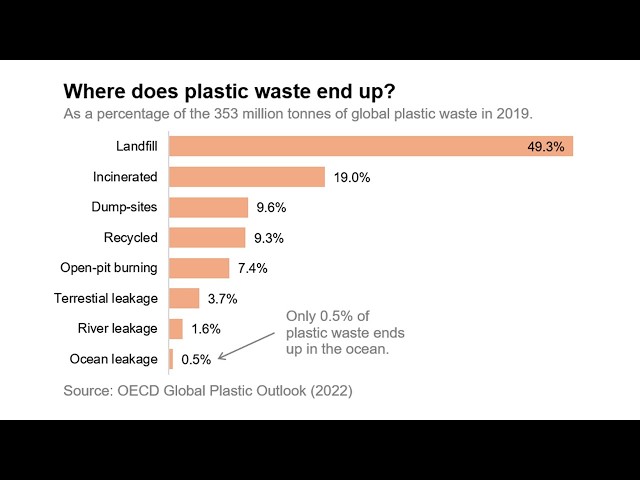
Data visualization in excel: better bar chart example

How to improve the formatting of a chart in excel.

9:42
Data visualization in excel: better bar chart example

444 views

4w ago

Frozzenrainbow
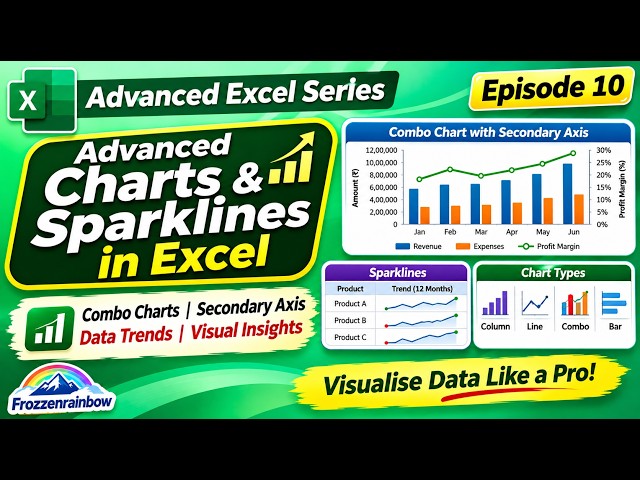
Advanced Excel Charts & Sparklines | Combo Charts, Secondary Axis & Data Trends | Episode 10

Take your Excel data visualisation skills to the next level! Learn how to create professional and informative charts using Advanced ...

6:47
Advanced Excel Charts & Sparklines | Combo Charts, Secondary Axis & Data Trends | Episode 10

32 views

8d ago

Frozzenrainbow
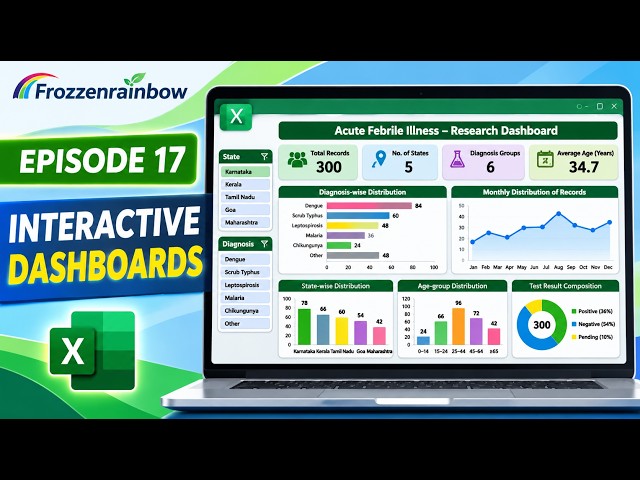
Create an Interactive Dashboard in Excel | Laboratory & Research Data Analysis | Episode 17

Create an Interactive Laboratory Dashboard in Microsoft Excel 365! Welcome to Episode 17 of the Frozzenrainbow Advanced ...

6:33
Create an Interactive Dashboard in Excel | Laboratory & Research Data Analysis | Episode 17

21 views

4d ago

Shaz Mathew
Build a LIVE Dashboard with Claude in Minutes (Claude Artifacts 2.0)

This tutorial is for anyone looking to improve their data visualization efficiency. We cover the setup process and show how to ...

11:43
Build a LIVE Dashboard with Claude in Minutes (Claude Artifacts 2.0)

167 views

2h ago

Office Monk
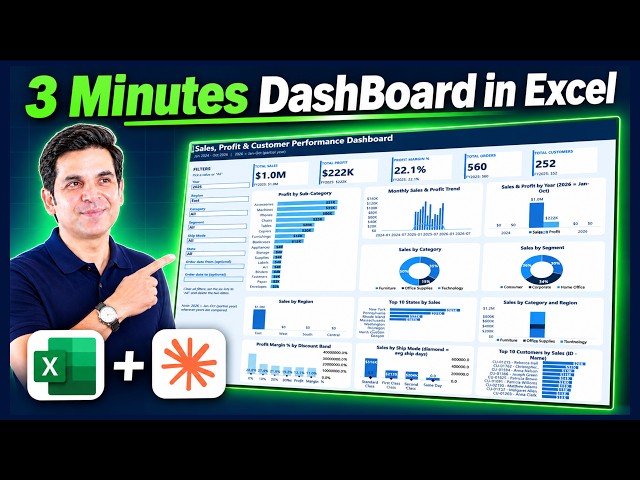
3 Minutes Dashboard in Excel with Claude AI No Prompt Needed!

Download the practice file / dashboard: https://tinyurl.com/mvh4ssn6 (Excel Data) https://tinyurl.com/3xc674dc (Prompt) ...

4:49
3 Minutes Dashboard in Excel with Claude AI No Prompt Needed!

89 views

9h ago

Centre of Best Learnings (CBL)
Create an interactive excel dashboard to track and visualise progress dynamically | full tutorial

Create an interactive excel dashboard to track and visualise progress dynamically (full tutorial) #exceldashboard ...

11:28
Create an interactive excel dashboard to track and visualise progress dynamically | full tutorial

105 views

4d ago

Frozzenrainbow
Create an Interactive Dashboard in Excel | PivotTables, Charts & KPI Cards &Advanced Excel Episode 4

Data analysts. - Laboratory professionals. - Anyone interested in Excel data visualization. Software: Microsoft Excel 365 ...

6:44
Create an Interactive Dashboard in Excel | PivotTables, Charts & KPI Cards &Advanced Excel Episode 4

170 views

2w ago

Jopa Excel
I Turned 30,000 Excel Rows Into an Interactive Dashboard with AI📊

With AI-powered data visualization, thousands of records can be transformed into interactive charts, KPI indicators, performance ...

11:37
I Turned 30,000 Excel Rows Into an Interactive Dashboard with AI📊

694 views

3w ago

AdvanVis
Learn Power BI in 5 Minutes (2026) | Beginner Tutorial: Excel to Dashboard

Go from an Excel file to an interactive Power BI report in five minutes, in real Power BI Desktop. No experience needed.

6:44
Learn Power BI in 5 Minutes (2026) | Beginner Tutorial: Excel to Dashboard

121 views

8d ago

HildaFonse Microsoft & Statistics
Introduction To Excel Charts HM&S 90

Welcome to the Introduction to Charts in Microsoft Excel tutorial HM&S 90 In this video, we begin our journey into data ...

13:22
Introduction To Excel Charts HM&S 90

69 views

4d ago

Ani Björkström | AI for Finance professionals
Why Are We Still Paying for Power BI? I Tested Claude Dashboards on a Real Excel Report

Plans and Enterprise setup 2:00 Step 1: Understand the Excel data 3:32 Budget and revenue-by-region tabs 4:55 The old way: ...

14:28
Why Are We Still Paying for Power BI? I Tested Claude Dashboards on a Real Excel Report

1,346 views

1mo ago

Ankit Sen
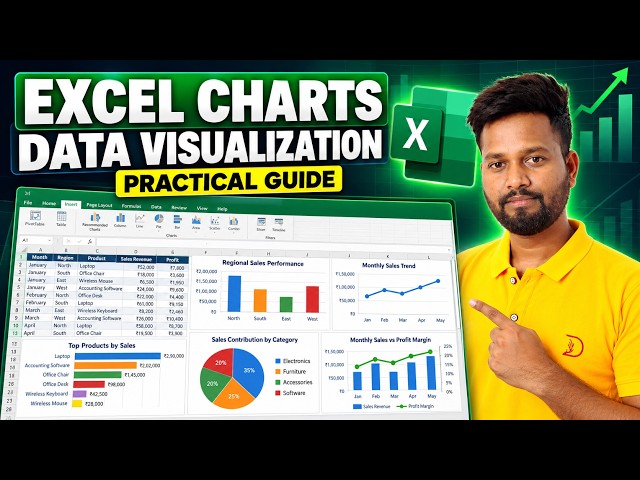
Excel Charts & Data Visualization Tutorial | Create Professional Charts in Excel

Learn Microsoft Excel Charts and Data Visualization with practical, real-world examples! In this tutorial, you'll learn how to create ...

6:45
Excel Charts & Data Visualization Tutorial | Create Professional Charts in Excel

268 views

3w ago

Vedakarna
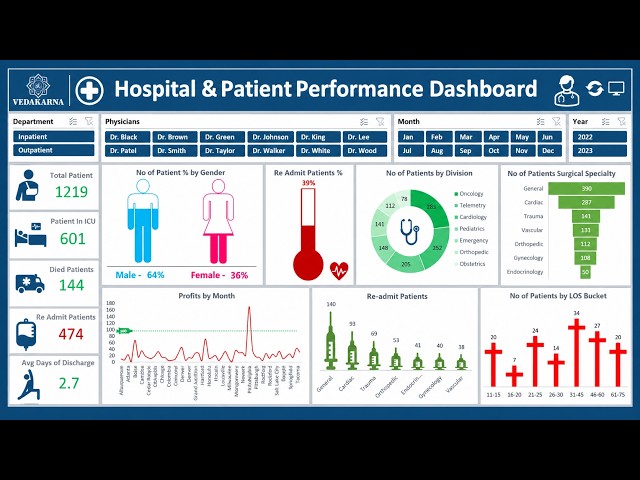
The Ultimate Hospital Performance Dashboard in Excel (Beginner to Pro)

... #ExcelTips #HealthcareDashboard #PatientAnalytics #PivotTable #ExcelSkills #BusinessIntelligence #DataVisualization.

16:08
The Ultimate Hospital Performance Dashboard in Excel (Beginner to Pro)

3,887 views

3w ago