ViewTube

ViewTube
Sign inSign upSubscriptions
Filters

Upload date

Type

Duration

Sort by

Features

Reset

302 results

Code with Rizwan
I Gave AI My Excel File… It Built a Complete Sales Dashboard!

Can AI turn a simple Excel file into a professional, interactive sales dashboard? In this video, I put AI to the test and build a ...

6:42
I Gave AI My Excel File… It Built a Complete Sales Dashboard!

15 views

6d ago

Centre of Best Learnings (CBL)
Create an interactive excel dashboard to track and visualise progress dynamically | full tutorial

Create an interactive excel dashboard to track and visualise progress dynamically (full tutorial) #exceldashboard ...

11:28
Create an interactive excel dashboard to track and visualise progress dynamically | full tutorial

105 views

4d ago

Esther Chinenye Anagu
Stop Learning Excel, SQL, and Power BI Without Doing This!

Planning to become a data analyst in 2027? You need to hear this. The industry is changing, especially with AI. And simply ...

17:51
Stop Learning Excel, SQL, and Power BI Without Doing This!

1,280 views

5d ago

Frozzenrainbow
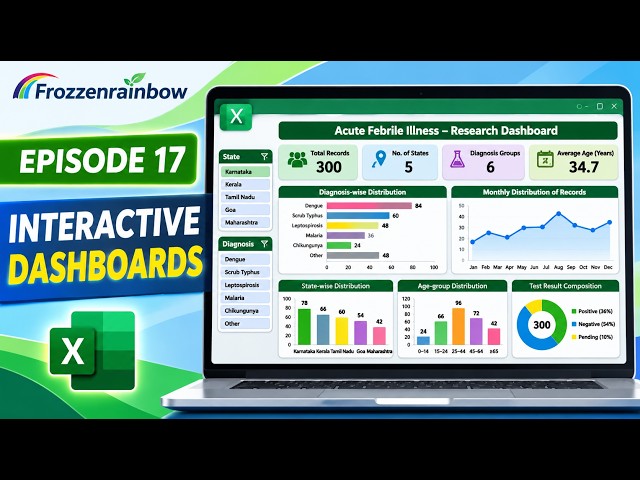
Create an Interactive Dashboard in Excel | Laboratory & Research Data Analysis | Episode 17

Create an Interactive Laboratory Dashboard in Microsoft Excel 365! Welcome to Episode 17 of the Frozzenrainbow Advanced ...

6:33
Create an Interactive Dashboard in Excel | Laboratory & Research Data Analysis | Episode 17

21 views

4d ago

bi-champ
What if AI built Excel apps and maps, not just charts?

Turn an Excel table into apps and maps, not just charts, and change them in plain English. Full walkthrough, the three datasets to ...

6:57
What if AI built Excel apps and maps, not just charts?

3,984 views

2d ago

Frozzenrainbow
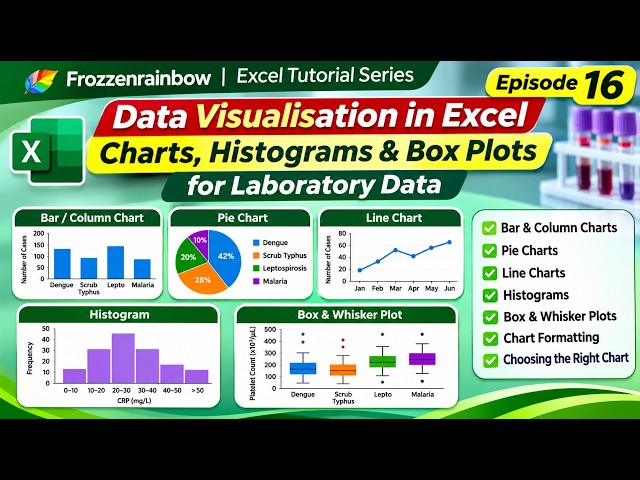
Data Visualisation in Excel | Bar Charts, Pie Charts, Histograms & Box Plots | Episode 16

Welcome to Episode 16 of the Frozzenrainbow Excel Tutorial Series! We are now entering the next phase of our Excel learning ...

6:23
Data Visualisation in Excel | Bar Charts, Pie Charts, Histograms & Box Plots | Episode 16

61 views

5d ago

HildaFonse Microsoft & Statistics
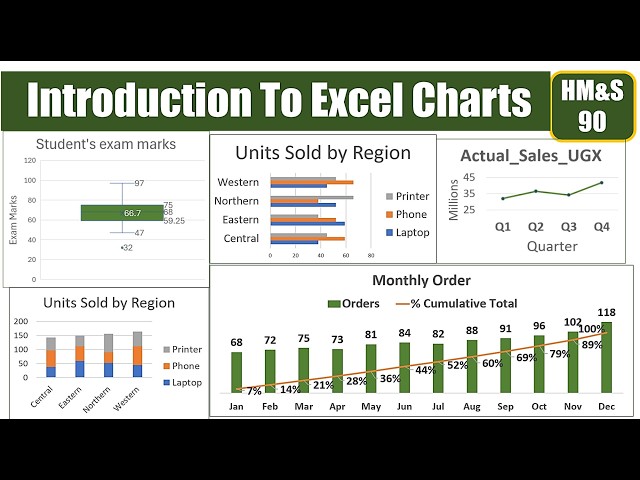
Introduction To Excel Charts HM&S 90

Welcome to the Introduction to Charts in Microsoft Excel tutorial HM&S 90 In this video, we begin our journey into data ...

13:22
Introduction To Excel Charts HM&S 90

69 views

4d ago

InfoZoom
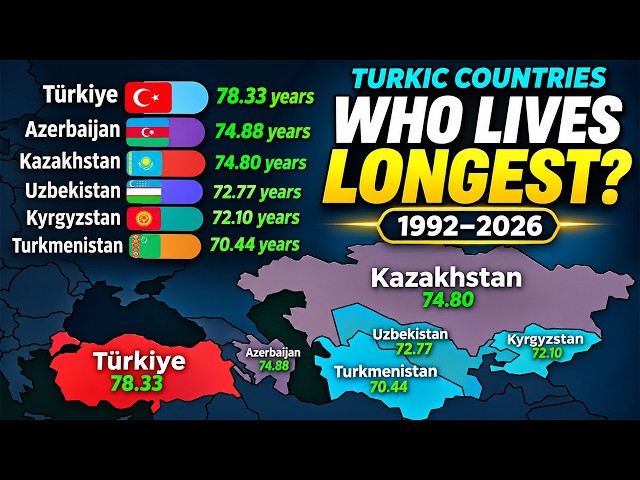
Which Turkic Country Lives the Longest? | 1992–2026

... both sexes combined #LifeExpectancy #TurkicCountries #Longevity #BarChartRace #DataVisualization #CountryComparison ...

8:06
Which Turkic Country Lives the Longest? | 1992–2026

1,136 views

6h ago

Office Monk
3 Minutes Dashboard in Excel with Claude AI No Prompt Needed!

Download the practice file / dashboard: https://tinyurl.com/mvh4ssn6 (Excel Data) https://tinyurl.com/3xc674dc (Prompt) ...

4:49
3 Minutes Dashboard in Excel with Claude AI No Prompt Needed!

89 views

9h ago

DrHayati
Spreadsheet: Using Excel

TOPIC 6: SPREADSHEET – USING EXCEL | Mastering Data Organisation, Analysis & Visualisation** **Welcome to Topic 6: ...

8:20
Spreadsheet: Using Excel

3 views

4d ago

MAG AI Studio
Master Excel & Google Sheets With AI

The provided source outlines a **comprehensive instructional framework** for mastering Microsoft Excel and Google Sheets ...

7:57
Master Excel & Google Sheets With AI

59 views

7d ago

SKILL MADE EASY
Excel vs SQL vs Python vs Power BI vs Tableau | When to Use Which Tool For Data Analysis?

Excel vs SQL vs Python vs Power BI vs Tableau | When to Use Which Tool For Data Analysis? Why do Data Analysts need so many ...

12:21
Excel vs SQL vs Python vs Power BI vs Tableau | When to Use Which Tool For Data Analysis?

154 views

6d ago

Practical Tool Lab
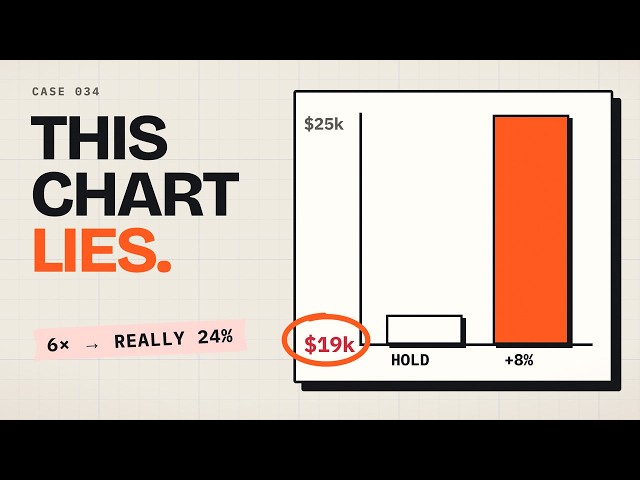
Misleading Charts: The Axis Trick That Exaggerates Results

Marisol's chart for the team makes an 8% price raise look like almost six times the profit. The real numbers: $20000 a month today ...

4:15
Misleading Charts: The Axis Trick That Exaggerates Results

0 views

4d ago

Master of Mylab
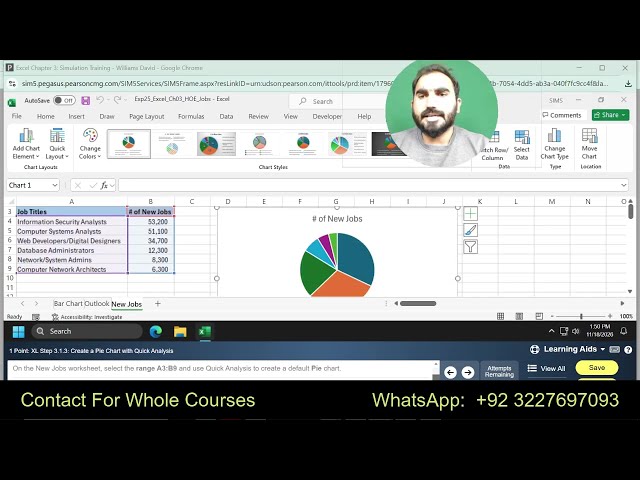
Excel Chapter 3 Simulation Training | Excel Simulation Training |excel chapter 3 simulation training

... #Spreadsheet #DataAnalysis #BusinessIntelligence #Productivity #TechSkills #ExcelSkills #DataVisualization #ExcelFormulas ...

14:55
Excel Chapter 3 Simulation Training | Excel Simulation Training |excel chapter 3 simulation training

6 views

9h ago

The Data Guy
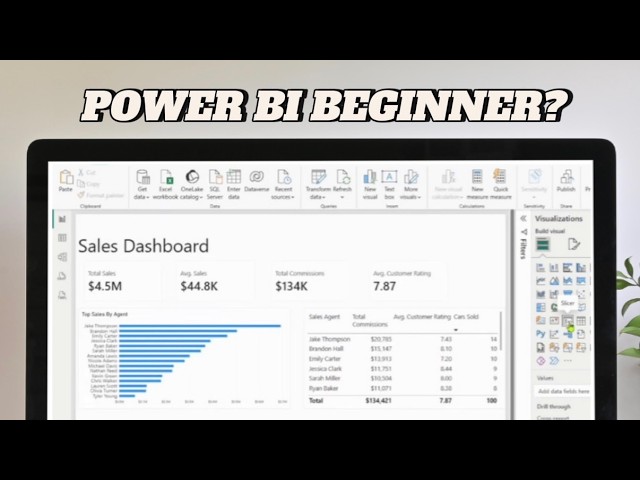
The Easiest Way to Build a Sales Dashboard in Power BI

#PowerBI #DataAnalytics #BusinessIntelligence #Dashboard #PowerBIBeginners #DataVisualization.

12:03
The Easiest Way to Build a Sales Dashboard in Power BI

87 views

7d ago

ThinkData Solutions, Inc
Why Use Power BI When You Already Have Excel? | Power BI Explained

If you already know how to build PivotTables, charts, and slicers in Excel, you may understand more about Power BI than you ...

4:08
Why Use Power BI When You Already Have Excel? | Power BI Explained

32 views

2d ago

Better Flow Systems
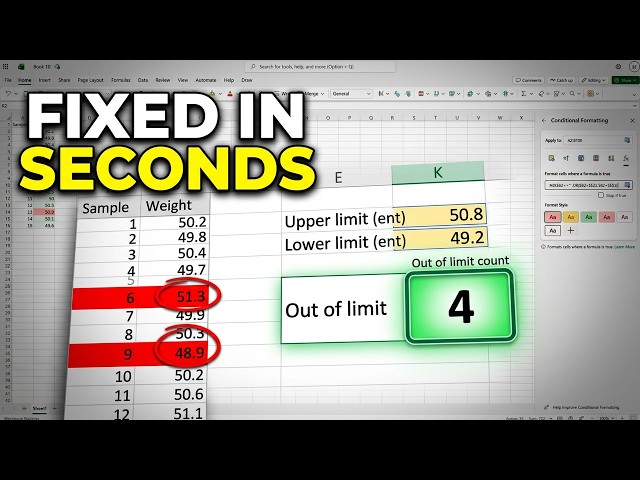
This Hidden Excel Feature Saves You Hours of Work

Make any reading outside your limits turn red automatically in Excel. Store the limits in their own cells and the colours update the ...

7:23
This Hidden Excel Feature Saves You Hours of Work

4 views

5d ago

James Blue
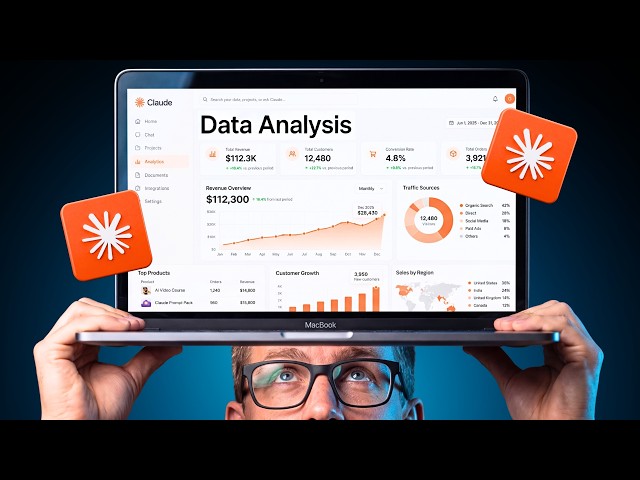
Master Claude for Data Analysis in 10 Minutes

Watch Next https://www.youtube.com/watch?v=aRCgyeyitdc In this video, I show how to use Claude for data analysis without ...

8:48
Master Claude for Data Analysis in 10 Minutes

18,962 views

4d ago

SK Discoveries 2024
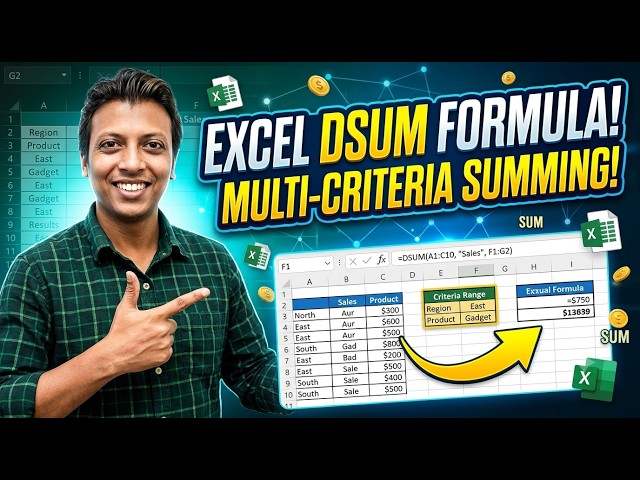
DSUM Formula in Excel: Stop Using SUMIFS! (The Database Approach)

Important Note: Please read carefully: The thumbnail for this video was created using AI to be eye-catching and effective. However ...

9:36
DSUM Formula in Excel: Stop Using SUMIFS! (The Database Approach)

24 views

2d ago

HEALTHCARE TIPS N TRICK BY PAYAAM VOHRA MEDICO
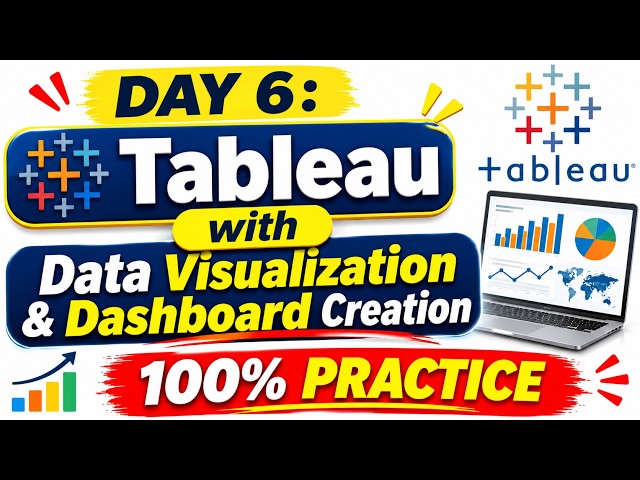
DAY 6 | TABLEAU TUTORIAL 🔥 | DATA VISUALIZATION & DASHBOARD CREATION | 100% PRACTICAL TRAINING

DM 8356077360 CONNECT WITH ME ACROSS ALL PLATFORMS: Official Learning Portal: ...

15:44
DAY 6 | TABLEAU TUTORIAL 🔥 | DATA VISUALIZATION & DASHBOARD CREATION | 100% PRACTICAL TRAINING

100 views

Streamed 4d ago