Upload date
All time
Last hour
Today
This week
This month
This year
Type
All
Video
Channel
Playlist
Movie
Duration
Short (< 4 minutes)
Medium (4-20 minutes)
Long (> 20 minutes)
Sort by
Relevance
Rating
View count
Features
HD
Subtitles/CC
Creative Commons
3D
Live
4K
360°
VR180
HDR
11,219 results
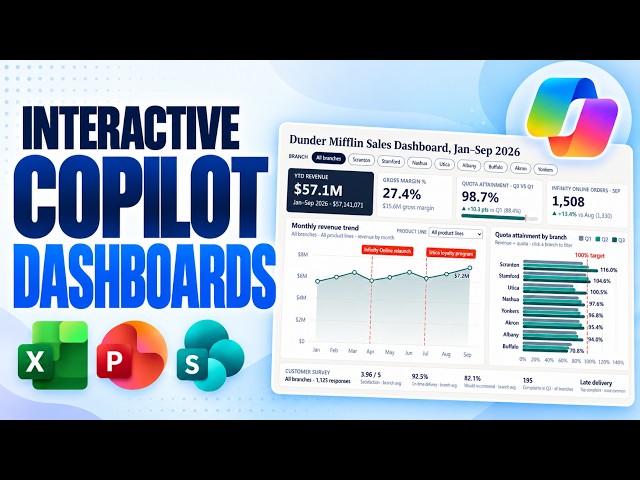
Learn how to create amazing interactive dashboards with new features in Microsoft Copilot in Excel, PowerPoint, and SharePoint.
75,488 views
2w ago
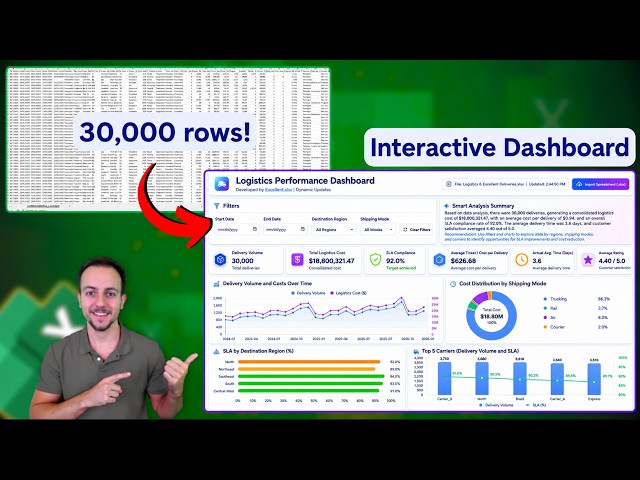
With AI-powered data visualization, thousands of records can be transformed into interactive charts, KPI indicators, performance ...
694 views
3w ago
Create an interactive excel dashboard to track and visualise progress dynamically (full tutorial) #exceldashboard ...
105 views
4d ago
Project Files: https://www.teachexcel.com/excel-tutorial/2742/e?src=yt_zVO8zfVCW9s Excel AI Course (On Sale): ...
26,684 views
4w ago
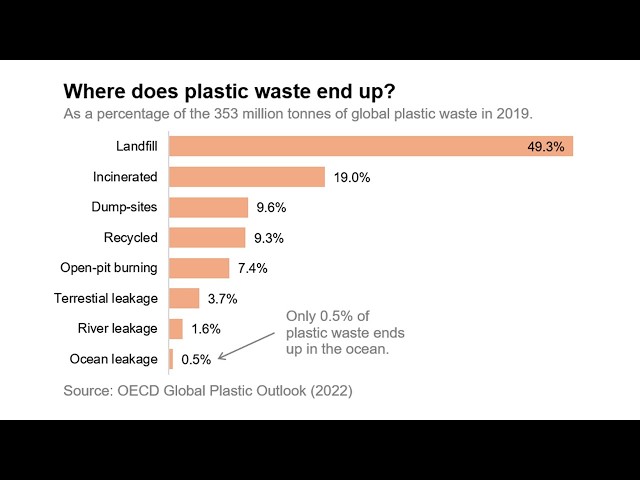
... the right one 2:37 Making it readable 4:04 A worked example 4:50 Common questions #excel #datavisualization #productivity.
13 views
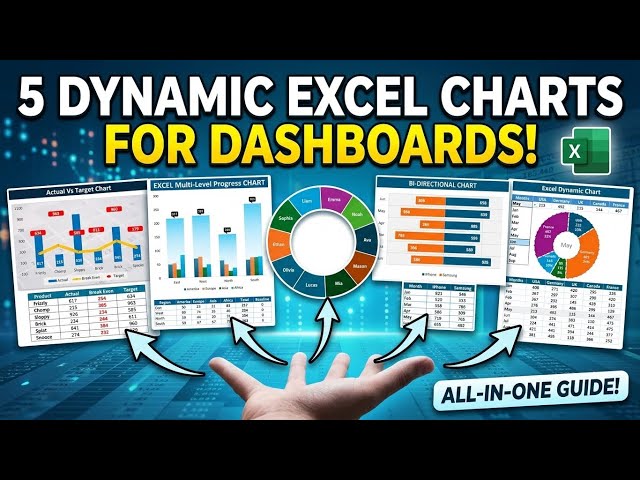
This excel tutorial has been Explained step by step. These type of excel data visualisation methods make your approach more ...
165 views
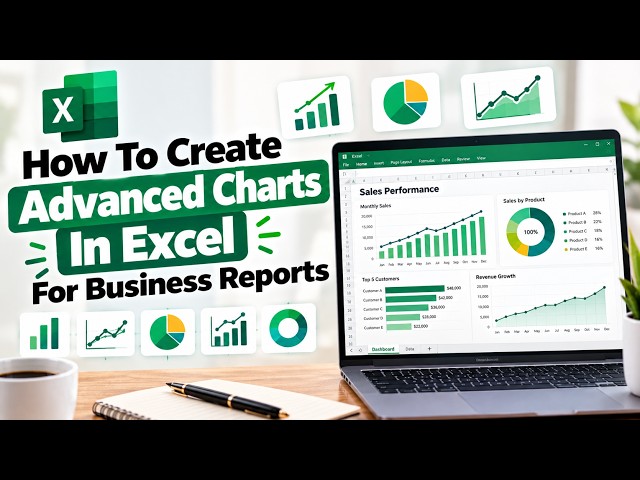
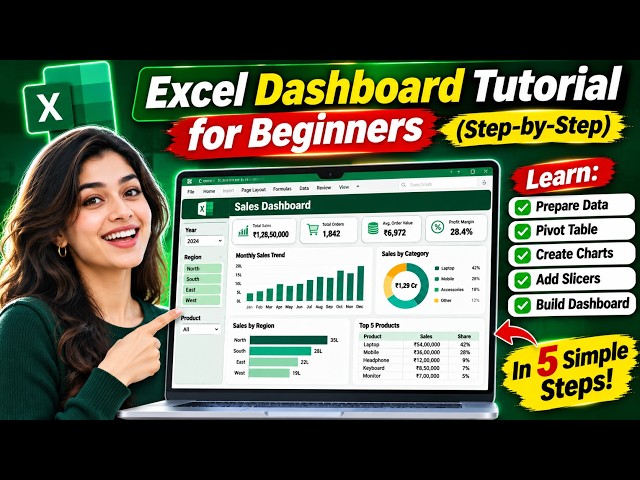
Want to turn your business data into professional and easy-to-understand reports? In this step-by-step Excel tutorial, you'll learn ...
30 views
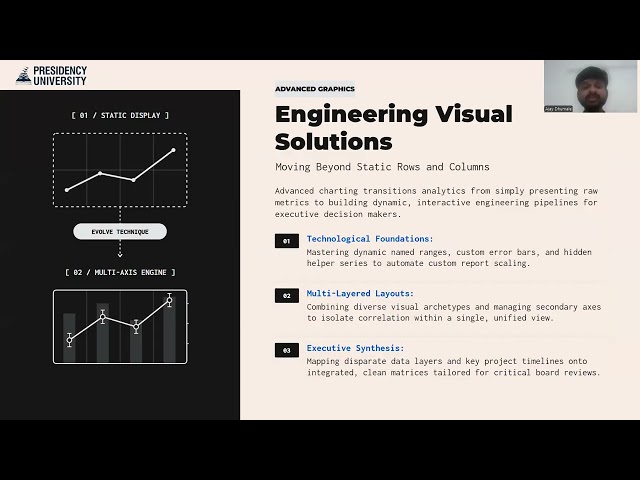
Choose and build the right chart: column charts, chart elements (titles, labels, legend), formatting for clarity, line charts for trends, ...
35 views
10d ago
Clean it first: Clean Messy Excel Data Automatically (Power Query to Power BI) https://www.youtube.com/watch?v=-K43hzBOAQY ...
85 views
9d ago
How to improve the formatting of a chart in excel.
444 views
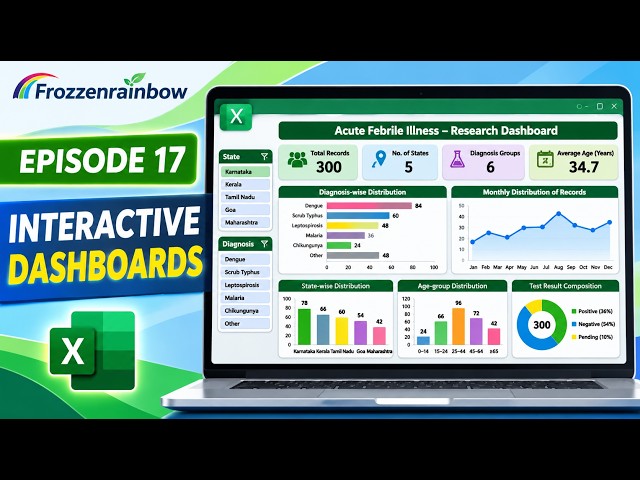
Create an Interactive Laboratory Dashboard in Microsoft Excel 365! Welcome to Episode 17 of the Frozzenrainbow Advanced ...
21 views
In this lesson, you'll learn how to use PivotTables in Microsoft Excel to summarize, organize, and analyze large amounts of data ...
94 views
Data analysts. - Laboratory professionals. - Anyone interested in Excel data visualization. Software: Microsoft Excel 365 ...
170 views
Clean a messy spreadsheet and build labeled, presentation-ready charts using ChatGPT Advanced Data Analysis, no coding ...
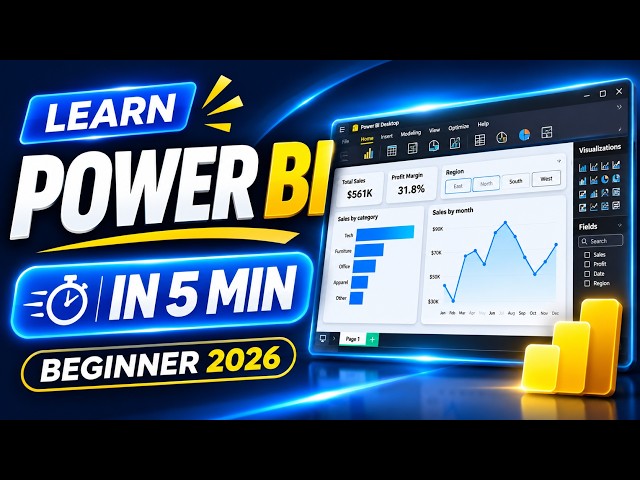
Go from an Excel file to an interactive Power BI report in five minutes, in real Power BI Desktop. No experience needed.
124 views
8d ago
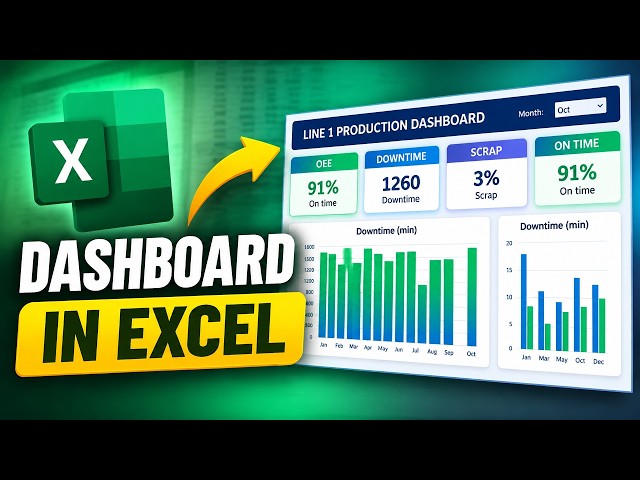
Build a custom Excel dashboard that shows your production metrics on one clean screen and updates automatically when you ...
15 views
12d ago
Want to turn raw data into powerful business insights using Microsoft Excel? Discover how to analyze data, visualize performance, ...
9 views
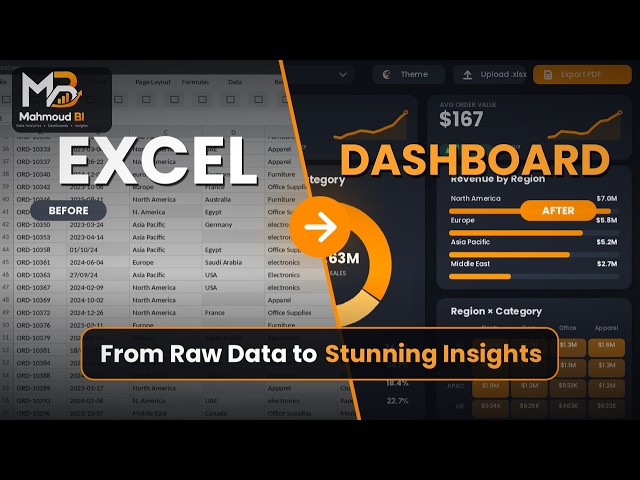
From boring spreadsheets to stunning business dashboards! Discover an impressive Before & After transformation that turns raw ...
0 views
Want to create a stunning and professional Excel Dashboard? In this video, I'll show you how to build an interactive Excel ...
6 views