Upload date
All time
Last hour
Today
This week
This month
This year
Type
All
Video
Channel
Playlist
Movie
Duration
Short (< 4 minutes)
Medium (4-20 minutes)
Long (> 20 minutes)
Sort by
Relevance
Rating
View count
Features
HD
Subtitles/CC
Creative Commons
3D
Live
4K
360°
VR180
HDR
52 results
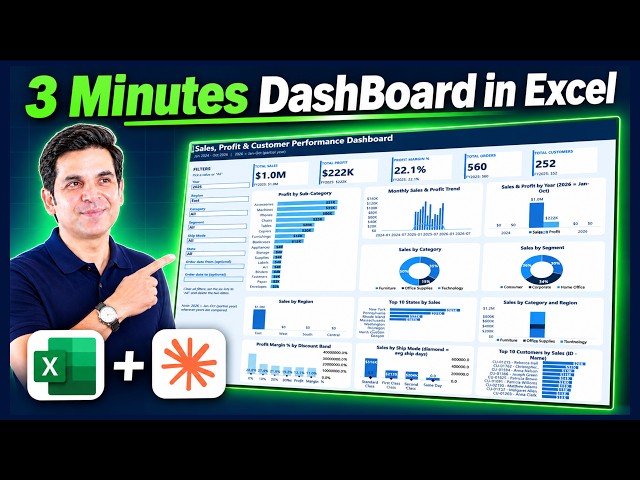
Download the practice file / dashboard: https://tinyurl.com/mvh4ssn6 (Excel Data) https://tinyurl.com/3xc674dc (Prompt) ...
97 views
13h ago
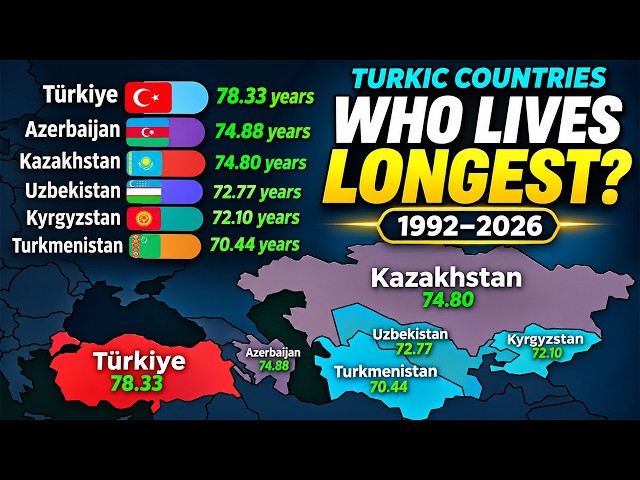
... both sexes combined #LifeExpectancy #TurkicCountries #Longevity #BarChartRace #DataVisualization #CountryComparison ...
2,174 views
9h ago
... #Spreadsheet #DataAnalysis #BusinessIntelligence #Productivity #TechSkills #ExcelSkills #DataVisualization #ExcelFormulas ...
6 views
12h ago
Not sure which visualization to use in Power BI? You're not alone! In this lesson, Robin Hunt demonstrates how to start with the ...
7 views
8h ago
This tutorial is for anyone looking to improve their data visualization efficiency. We cover the setup process and show how to ...
894 views
6h ago
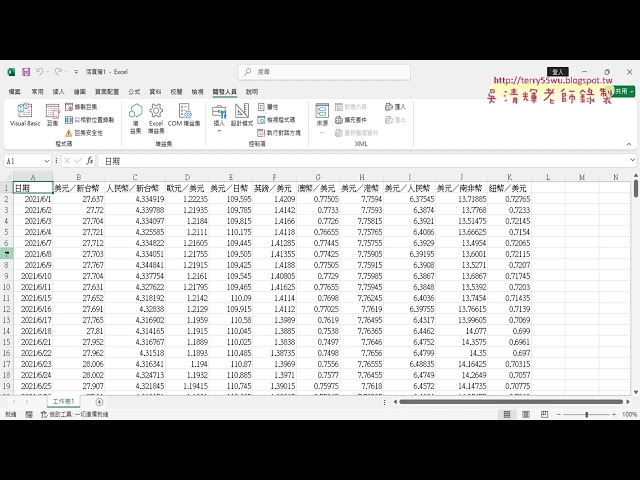
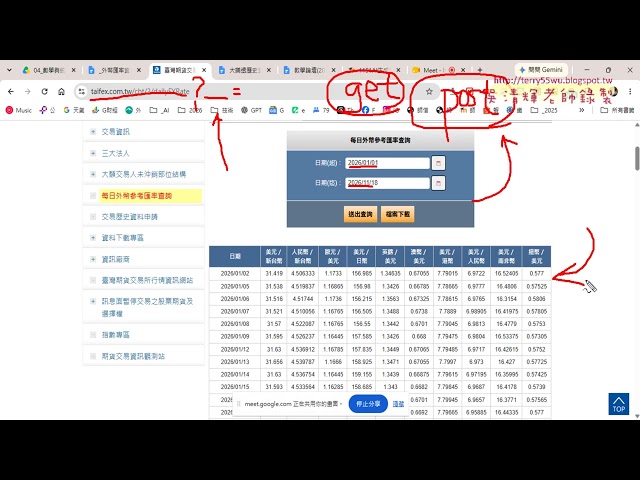
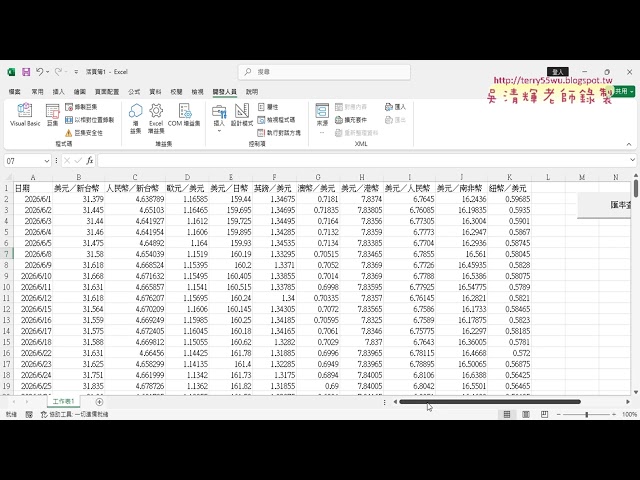
NTNU Advanced Spreadsheet Applications and Programming (202601B Class) - 9th Session 01_Using AI to Write a VBA Program for ...
14 views
14h ago
Learn how to improve your sales and commission spreadsheets in Excel in a practical way. Organize your data for a clear ...
447 views
2h ago
NTNU Advanced Spreadsheet Applications and Programming (202601B Class), 10th Session 01_Key Review and AI-Suggested ...
2 views
Knowing SQL, Python, Excel and Power BI is one thing. Using them together to solve a business problem is what makes you ...
0 views
38 min ago
9 views
100+ IT Full Courses in Telugu: ...
567 views
15h ago
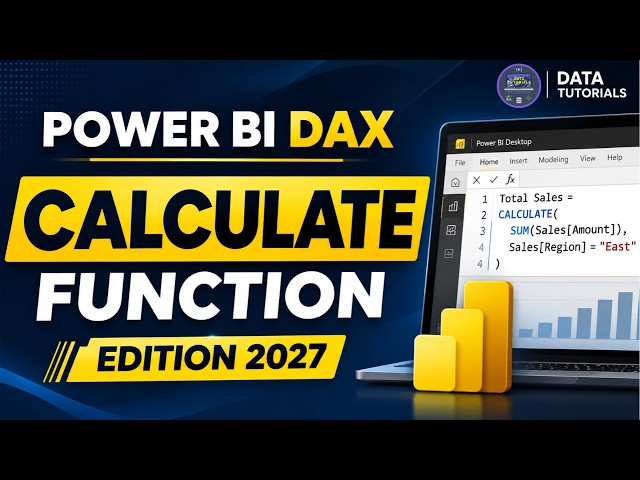
dax #powerbi #dataanalysis PACKAGED COURSES ✓ Power BI + SQL + Python + Fabric + Projects Course ...
697 views
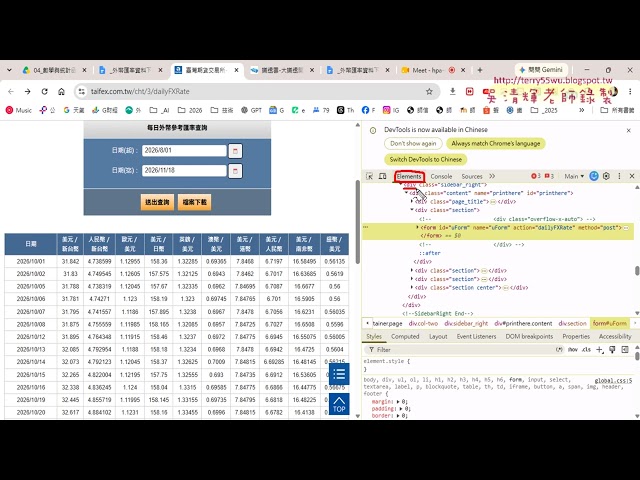
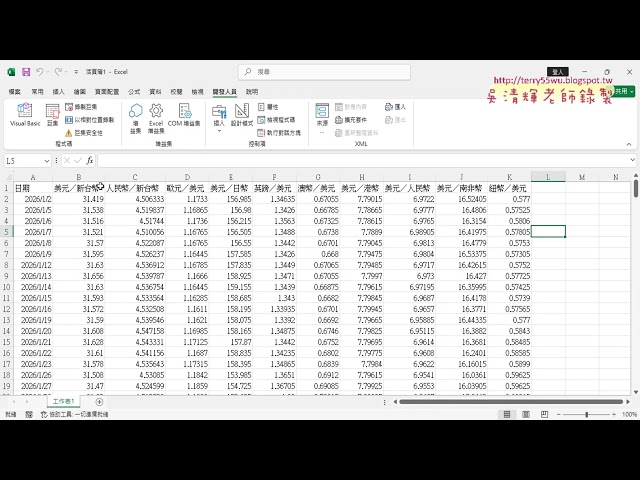
台師大AI生成試算表進階應用與程式設計202601B班第10次上課 01_重點複習與AI提示詞匯入外幣資料 02_增加InputBox輸入日期起 ...
11 views
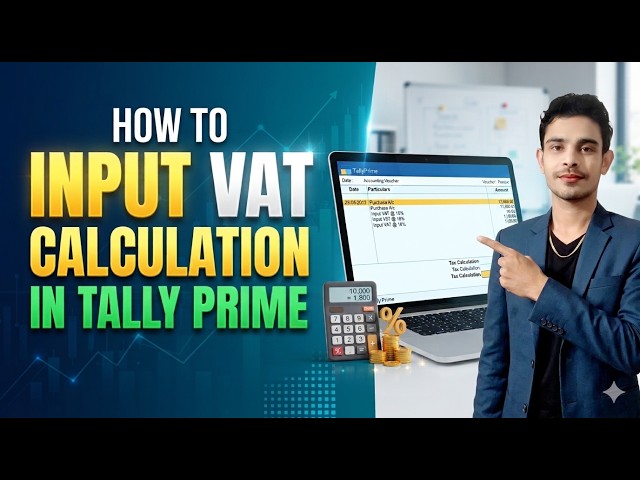
In this video you will learn how to calculate input vat in tally prime with easy and simple process. Welcome to our channel!
21h ago
In this video, we break down the Hexcel's financial performance using an intuitive heatmap visualization, making it easier to ...
23h ago
... Power BI & Data Visualization: https://exly.live/aThW5a ◑ E-Learning Portal for Continuous Upskilling: https://exly.live/aThW5a ...
Learn how to create a professional face icon for dashboards using only Microsoft Office Shapes. In this step-by-step tutorial, you'll ...
3h ago
🔥 🔗 Link: 👉🏻 🤳Telegram👇🏻 https://t.me/designwithrehana 😉You can also follow me on Social Media Platforms: 🤩Instagram ...
71 views