Upload date
All time
Last hour
Today
This week
This month
This year
Type
All
Video
Channel
Playlist
Movie
Duration
Short (< 4 minutes)
Medium (4-20 minutes)
Long (> 20 minutes)
Sort by
Relevance
Rating
View count
Features
HD
Subtitles/CC
Creative Commons
3D
Live
4K
360°
VR180
HDR
395,555 results
python #coding #matplotlib Matplotlib is a Python library used for data visualization. It provides a MATLAB-like interface for quick ...
62,184 views
1y ago
Resources & Further Learning - Example code ...
21,388 views
Learn matplotlib in this data science programming tutorial. Learn how to plot line graphs and histograms in Python using the ...
192,950 views
7y ago
This matplotlib legend tutorial walks you through basic and advanced options for matplotlib legends using Python code for a ...
23,215 views
5y ago
Today we learn a fundamental data science skill. We learn how to animate plots using Matplotlib in Python.
203,642 views
Data Used: https://www.nasdaq.com/market-activity/stocks/aapl/historical Google Colab Link: https://colab.research.google.com/ ...
14,930 views
3y ago
Our intro to Matplotlib in Python, focusing on how to turn raw data into beautiful plots. We start by creating basic plots, then builds ...
8,975 views
7mo ago
python #coding #matplotlib This video will give you an introduction to customizing plots with Matplotlib. In the next video, we will ...
15,058 views
notebook used in this tutorial: https://github.com/codebasics/py/blob/master/matpltlib/1_intro/1_matplotlib_introduction.ipynb ...
195,979 views
8y ago
Learn matplotlib python with 5 essential charts: plot, bar, hist, scatter and pie. Perfect for any data visualization and python ...
989 views
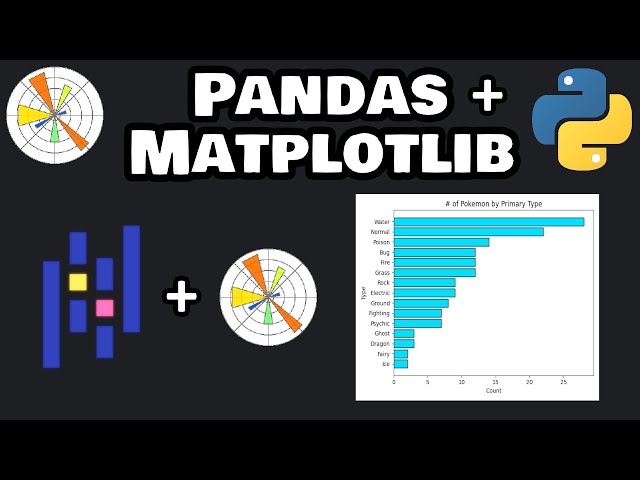
python #coding #matplotlib This video serves as a project where we will create a bar chart based on the primary Type of the ...
13,506 views
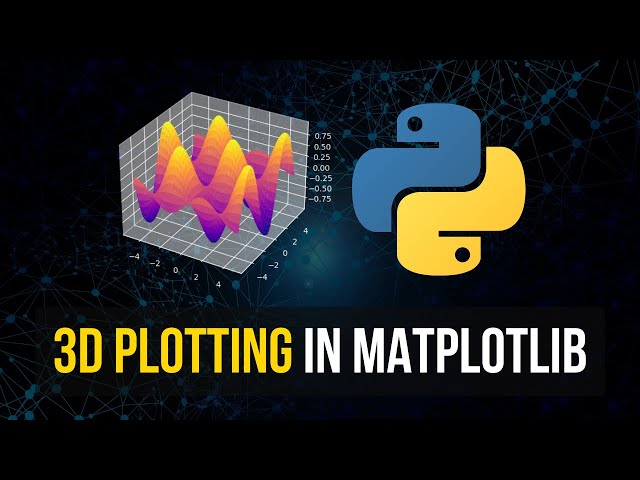
In this video we learn how to visualize 3D plots in Matplotlib. ◾◾◾◾◾◾◾◾◾◾◾◾◾◾◾◾◾ Programming Books ...
154,328 views
Visualization is central to the process of how we think. This video reviews the inner workings of Python's most popular plotting ...
4,064 views
サプーの書籍が絶賛発売中 Amazon ▶︎ https://www.amazon.co.jp/dp/4297142856 「VTuberサプーが教える! Python 初心者 ...
63,081 views
In this tutorial, we have explained how to create heatmap charts using the Python data visualization library "matplotlib".
2,159 views
Actual Video starts at : 3:03 Google Colab : https://colab.research.google.com/ Follow us on Instagram code io ...
2,643 views
6mo ago
In this video, learn how to install matplotlib on Windows. We will also install Python 3 and pip. PIP is used to install and manage ...
11,739 views
11mo ago
Complete SciPy 2015 Talk & Tutorial Playlist here: http://ow.ly/PHjEN.
177,851 views
11y ago
In this video, we will be learning how to create histograms in Matplotlib. This video is sponsored by Brilliant.
213,923 views
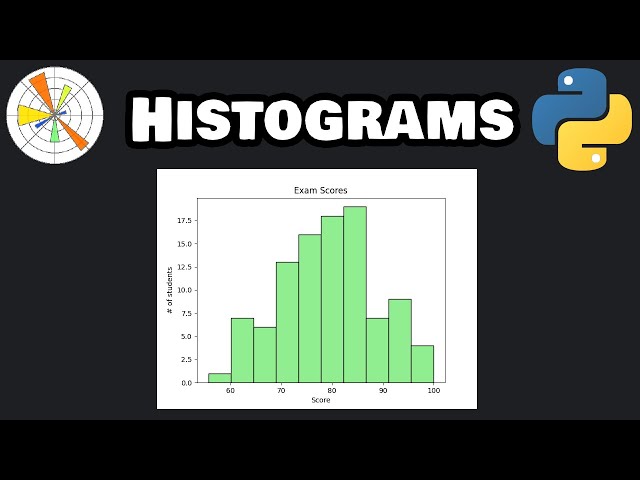
python #coding #matplotlib In this video we will create a basic histogram using Matplotlib.
13,232 views