Upload date
All time
Last hour
Today
This week
This month
This year
Type
All
Video
Channel
Playlist
Movie
Duration
Short (< 4 minutes)
Medium (4-20 minutes)
Long (> 20 minutes)
Sort by
Relevance
Rating
View count
Features
HD
Subtitles/CC
Creative Commons
3D
Live
4K
360°
VR180
HDR
291 results
This video shows how to use matplotlib on the Arrhenius HPC cluster, as part of the NAISS course 'Python for HPC', following the ...
7 views
1d ago
Learn Python Data Science with NumPy, Pandas & Matplotlib! Explore data manipulation, analysis, and visualization with ...
97 views
#2 Matplotlib Learn Series in Python | Install Matplotlib & Create Your First Graph Do you want to learn data visualization ...
37 views
2d ago
3 Matplotlib Sikho Series in Python | plt.figure() & plt.subplots() Tutorial In this 3rd lecture of the Matplotlib Sikho Series, you'll ...
26 views
Add Confidence Bands to Matplotlib Charts.
96 views
4d ago
Learn Charts 2 in Python, step by step, with real code you can run: Why not a line?, Load pandas and matplotlib again, Read ...
1 view
Learn Charts 3 in Python, step by step, with real code you can run: Install and our data, Load pandas and matplotlib, Read the ...
6 views
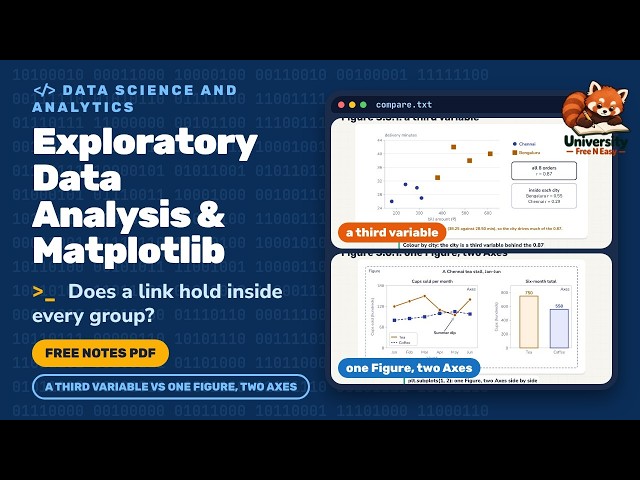
Exploratory Data Analysis and Matplotlib: Data Science and Analytics for B.Tech Computer Science, explained in one animated ...
4 views
5d ago
Learn Charts 2 in Python, step by step, with real code you can run: Load pandas and matplotlib, Read the real day.csv file, ...
85 views
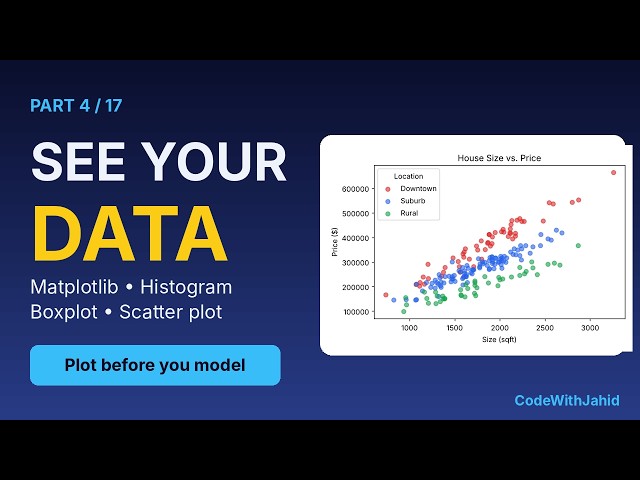
Plot before you model! In Part 4 of the CodeWithJahid machine learning course, you learn how to look at your data with charts, ...
6d ago
BP101T — Basics of Python Programming for Pharmaceutical Sciences. Unit 5 lecture in simple ENGLISH language, with ...
17 views
Data Analytics Tutorial: Episode 30 of SyntaxPilot's free Data Analytics full course, with real-life examples for every concept.
0 views
Learn Charts 1 in Python, step by step, with real code you can run: Why use a chart, Parts of a chart, Import pandas and matplotlib ...
5 views
Learn Charts 1 in Python, step by step, with real code you can run: Why a bar chart, Load pandas and matplotlib again, Read the ...
10 views
matplotlib tutorial in Hindi: Matplotlib is Python's charting library; plt.plot, plt.bar and plt.pie turn Pandas numbers into charts.
Lesson 38 of the Python Data Analytics Full Course: What the World Eats, and Its Carbon Footprint. Today we're looking at food: ...
Your spreadsheet has ten thousand rows and one question: which product sold best last month. In Python, that answer is about ...
2 views
I have been slacking off on video making this week and I will get back up to speed next week.
P3- Q.1ef - Python Program Structure, Numpy and Matplotlib Libraries | MCS201 Solved Question Paper Questions:- 00:05 - 1. (e ...
48 views
Class 12 Informatics Practices (IP) - Matplotlib Basics Explained! In this video, we cover two of the most important data ...
13 views