Upload date
All time
Last hour
Today
This week
This month
This year
Type
All
Video
Channel
Playlist
Movie
Duration
Short (< 4 minutes)
Medium (4-20 minutes)
Long (> 20 minutes)
Sort by
Relevance
Rating
View count
Features
HD
Subtitles/CC
Creative Commons
3D
Live
4K
360°
VR180
HDR
21,481 results
Our intro to Matplotlib in Python, focusing on how to turn raw data into beautiful plots. We start by creating basic plots, then builds ...
8,975 views
7mo ago
Early Black Friday Savings! Save $160 on a full year of Maven Pro https://bit.ly/4C13VCQ Visualizing data helps you ...
2,765 views
9mo ago
Our favourite plotting library may just be matplotlib again now that we made it interactive with a puck! It may sounds strange at first, ...
7,960 views
427 views
10mo ago
Start building powerful data visualizations in Python! In Lesson 1 of our Matplotlib series, we cover everything you need to know to ...
15 views
2w ago
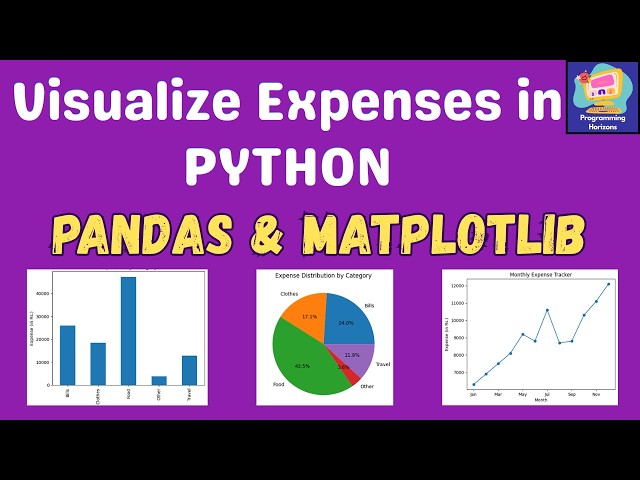
Learn data visualization in Python using Pandas and Matplotlib in this beginner-friendly project tutorial. You'll learn how to load ...
200 views
4mo ago
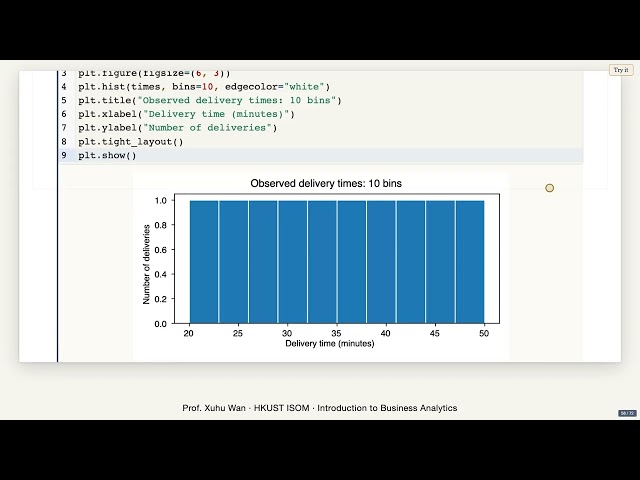
How to Create Histograms in Python (Matplotlib) In this video, you'll learn how to create and customize histograms using ...
112 views
2mo ago
Data visualization - Matplotlib vs Seaborn vs Plotly | Which Should You Learn First? we begin one of the most important and ...
617 views
6mo ago
Need some help with a project or some consulting? Contact me here: https://www.neuralnine.com/services Code: ...
3,855 views
Matplotlib is powerful — but many developers struggle once they go beyond a simple plot. In this video, you'll unlock Matplotlib ...
379 views
Actual Video starts at : 3:03 Google Colab : https://colab.research.google.com/ Follow us on Instagram code io ...
2,643 views
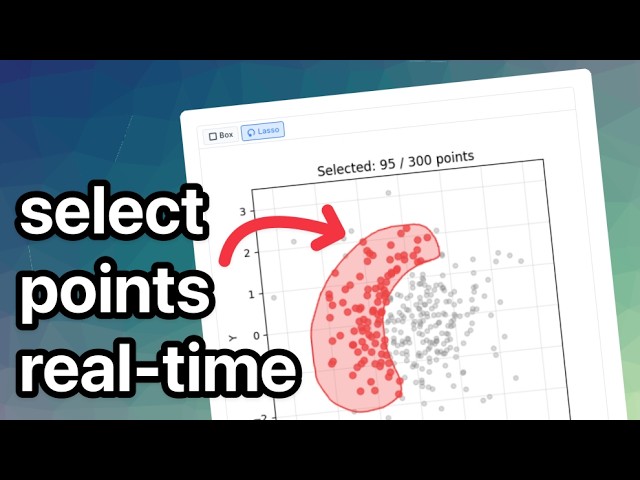
When we made the first interactive PuckChart we didn't realize that a box/lasso utility on a scatter chart would be a better idea.
2,611 views
In this video, learn how to install matplotlib on Windows. We will also install Python 3 and pip. PIP is used to install and manage ...
11,739 views
11mo ago
A useful chart starts with a question. Run and revise line charts, bars, histograms and scatterplots, then check whether the labels ...
227 views
1mo ago
Matplotlib in Python and create powerful data visualizations like line, bar, and scatter plots with easy examples. Perfect for ...
50 views
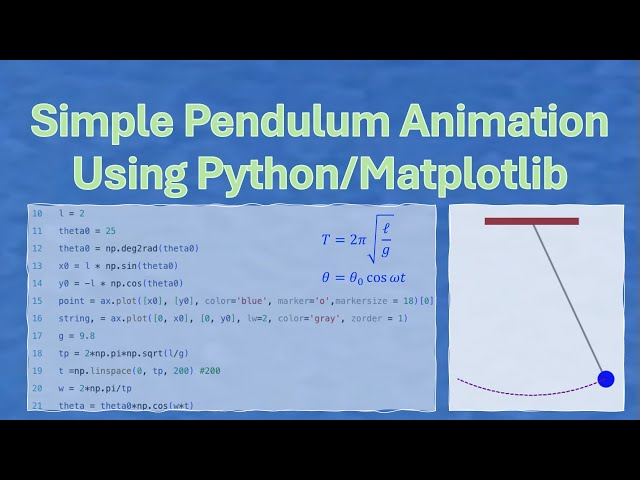
In this video, you will learn how to write a python program to do the animation of a simple pendulum. Step by step instructions are ...
114 views
Learn Python Data Science with NumPy, Pandas & Matplotlib! Explore data manipulation, analysis, and visualization with ...
97 views
1d ago
Learn matplotlib python with 5 essential charts: plot, bar, hist, scatter and pie. Perfect for any data visualization and python ...
989 views
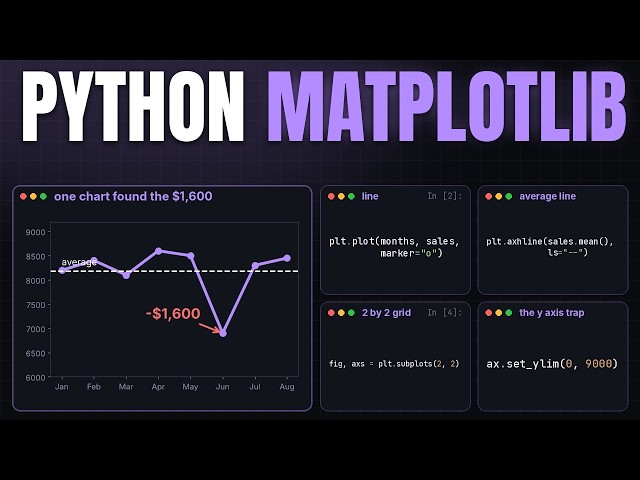
A coffee shop lost 1600 dollars in one month and the owner could not see why in her spreadsheet. One line chart showed it ...
17 views
In this tutorial, You will learn how to create a simple *Matplotlib line chart (plot)* to visualize your data using Python. This tutorial is ...
428 views