Upload date
All time
Last hour
Today
This week
This month
This year
Type
All
Video
Channel
Playlist
Movie
Duration
Short (< 4 minutes)
Medium (4-20 minutes)
Long (> 20 minutes)
Sort by
Relevance
Rating
View count
Features
HD
Subtitles/CC
Creative Commons
3D
Live
4K
360°
VR180
HDR
187 results
Try Hi3D V3.0 here: ...
8,608 views
15h ago
Learn data visualization in plain Python covering scales, axes, breaks, and ticks. You build a linear axis, a log axis with powers of ...
0 views
5h ago
Turn your numbers into charts people remember! Pennine Technolabs is excited to introduce its Charts & Graphs Widget, now ...
2 views
Try Hyper3D Agentic Mode: https://hyper3d.ai/features/image-to-3d?utm_source=YouTube&utm_medium=video&utm_campaign=Agentic ...
239 views
2h ago
NTNU Advanced Spreadsheet Applications and Programming (202601B Class), 10th Session 01_Key Review and AI-Suggested ...
4h ago
git history visualization of https://github.com/rubocop-hq/rubocop 8 years, 8 months of development, 806 contributors watch on ...
9 views
22h ago
Fall into a big enough black hole, and you might not feel a thing at the edge. This is a simulated trip, step by step, with real physics ...
6 min ago
Heat Map Widget in Orange Data Mining | Data Visualization Tutorial | No Coding Can you analyze 400 numbers in just a few ...
1 view
4 min ago
This video builds a map of US state populations using GeoPandas, pygris, and Polars—everything needed to go from a blank ...
Tutorial for how to install the OSDR-BioData-API skills package in VScode Copilot. OSDR BioData API GitHub Repository: ...
11 views
18h ago
Join this channel to get access to perks: https://www.youtube.com/channel/UC0nk24muIA7ix5z7DkpIGSg/join How to automate ...
3 views
9h ago
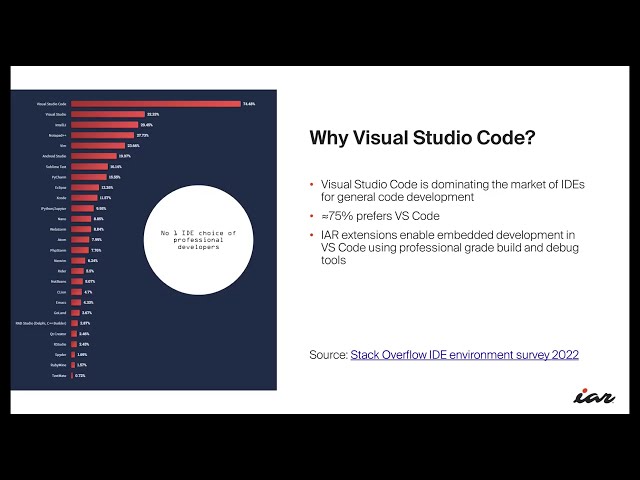
Embedded codebases are growing, and development teams are eager to modernize their workflows, improve performance, and ...
1h ago
Learn how to automate professional motion graphics using React and Remotion, without manually creating every animation from ...
44 views
23h ago
Ten ways code transforms pictures: four-color dithering, noise removal, local ink thresholds, color registration, low-rank ...
Join this channel to get access to perks: https://www.youtube.com/channel/UC0nk24muIA7ix5z7DkpIGSg/join How to analyze AI ...
Python in Excel 365 (monthly/current) allows you to visualize your planned, actual, and forecast figures in ISO 24896:2026 ...
1,941 views
21h ago
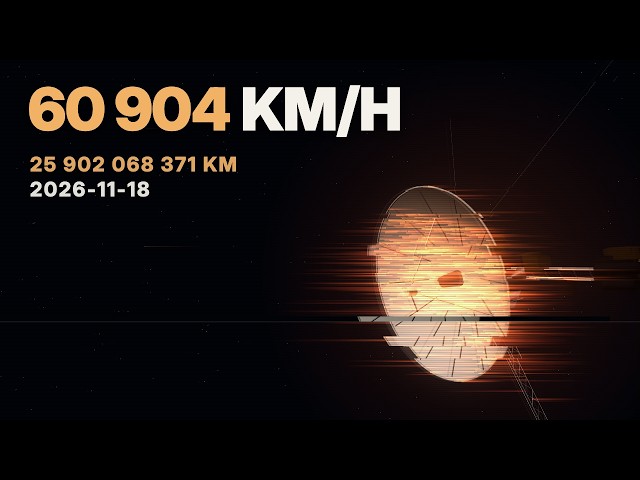
In November 2023, Voyager 1, the most distant machine humans have ever built, stopped making sense. Instead of data, it sent ...
Claude can make animations, but you get one flat MP4: one wrong word and you prompt it all again. Here Claude builds the film ...
1,756 views
19h ago
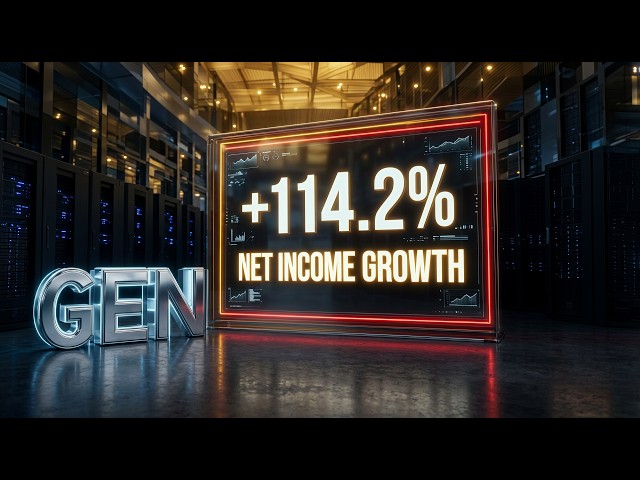
In this video, we break down the Gen Digital's financial performance using an intuitive heatmap visualization, making it easier to ...
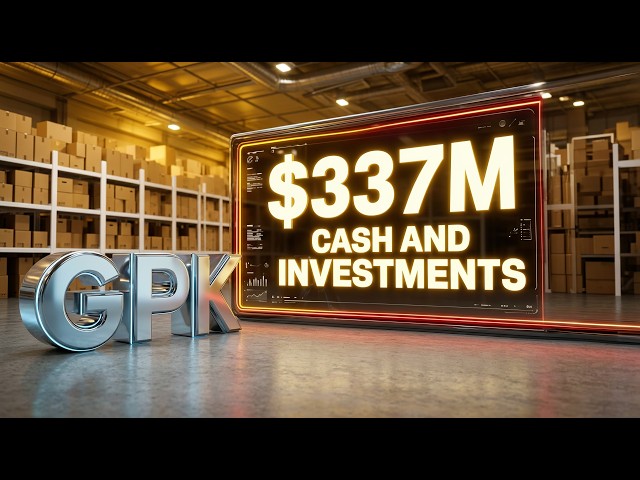
In this video, we break down the Graphic Packaging's financial performance using an intuitive heatmap visualization, making it ...