ViewTube

ViewTube
Sign inSign upSubscriptions
Filters

Upload date

Type

Duration

Sort by

Features

Reset

120 results

EzyMath
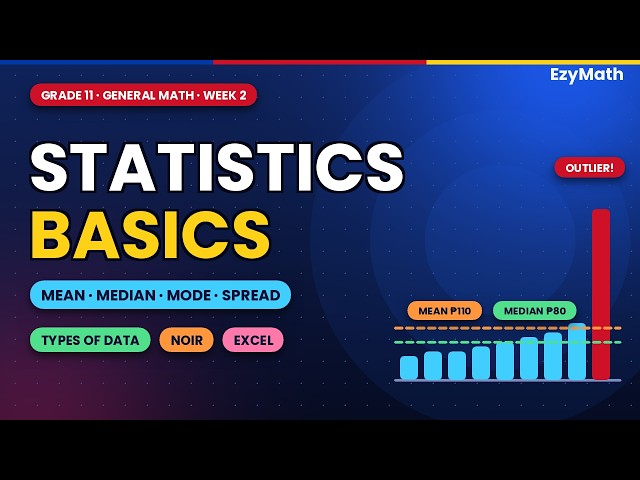
Statistics Basics | Types of Data, Mean, Median, Mode & Standard Deviation |Grade 11 General Math

Is the "average" always the best way to describe data? Not when there is an outlier! In this Grade 11 General Mathematics lesson ...

11:00
Statistics Basics | Types of Data, Mean, Median, Mode & Standard Deviation |Grade 11 General Math

17 views

14h ago

BOOKS in 8 Minutes
Statistical Analysis with Excel For Dummies, 5th Edition by Joseph Schmuller (2022)

Statistical Analysis with Excel For Dummies, 5th Edition by Joseph Schmuller (2022) This Books in 8 Minutes episode breaks ...

7:43
Statistical Analysis with Excel For Dummies, 5th Edition by Joseph Schmuller (2022)

2 views

20h ago

DROMCA Learning
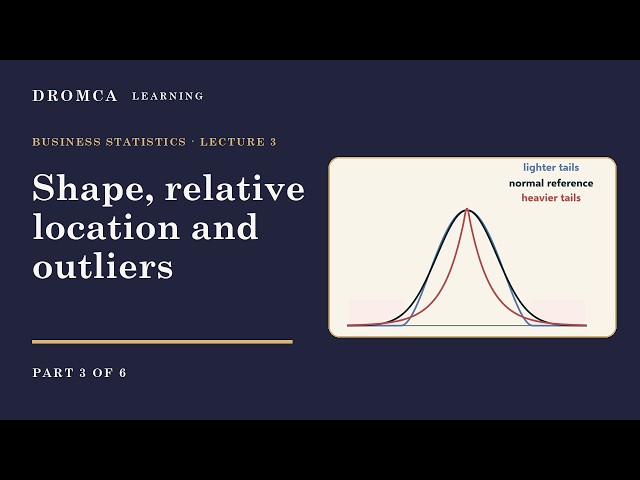
Skewness, Kurtosis, z-Scores and Outliers | Business Statistics, Lecture 3, Part 3

What shape does a distribution have, and where does one value stand within it? This part measures skewness and kurtosis, ...

7:18
Skewness, Kurtosis, z-Scores and Outliers | Business Statistics, Lecture 3, Part 3

0 views

10h ago

MLZeroToHero
Why the Average Lies: Mean, Median and Outliers

Five friends, one rich outlier, and an average that describes nobody. Learn the descriptive statistics behind every dataset: mean, ...

7:50
Why the Average Lies: Mean, Median and Outliers

1 view

1d ago

Robbie Pasquale
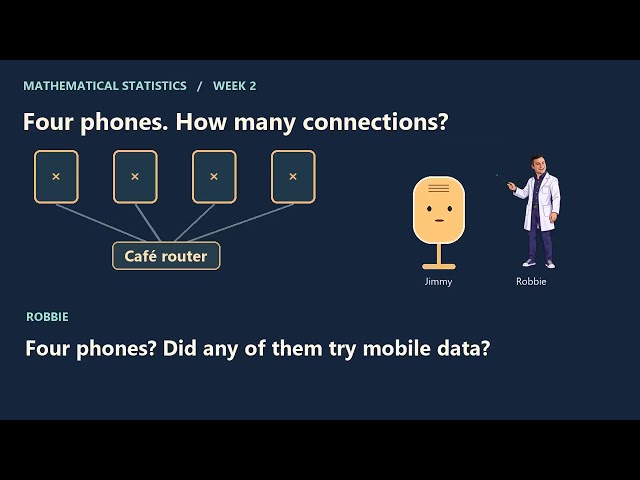
Sampling Distributions and Standard Error | Mathematical Statistics Week 2

If I run the same test twice, how far apart should I expect the results to be? This week Jimmy and I look at the spread of estimates ...

5:13
Sampling Distributions and Standard Error | Mathematical Statistics Week 2

5 views

19h ago

colino
Histogram frequency table: how to group and read data

You can try colino for free here: https://colino.app/get/youtube In colino, you take photos of your math homework and get ...

4:58
Histogram frequency table: how to group and read data

2 views

16h ago

Infinity Systems
Merging, Joining and Reshaping Tables | Data Science E16

Learn to combine and reshape tables in pandas. We solve the E15 department exercise, then cover merge and join, join types ...

11:05
Merging, Joining and Reshaping Tables | Data Science E16

8 views

23h ago

Tech with Sundus
Grouped Data | Probability And Statistics | Part 2 | @TechwithSundus

0:00 intro 0:10 first quartile #maths #mean #medians #deviation #techwithsundus Mean Mode Medain Co-effient of Variance ...

15:31
Grouped Data | Probability And Statistics | Part 2 | @TechwithSundus

3 views

23h ago

L'Anchors
Sample Size of 30: Why It Works? and When It Fails?

Why is 30 the minimum sample size? • How can a small sample give an unreliable Standard Error and so miss the true population ...

5:26
Sample Size of 30: Why It Works? and When It Fails?

4 views

23h ago

Food Risk Models Explained
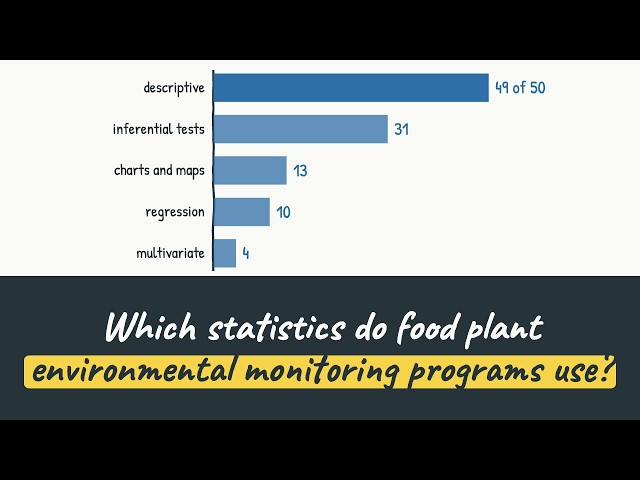
Statistical Tools for Environmental Monitoring Data in Food Plants

Food plants routinely swab floors, drains, and equipment for bacteria such as Listeria, but there is little standard guidance on how ...

4:48
Statistical Tools for Environmental Monitoring Data in Food Plants

3 views

20h ago

Robbie Pasquale
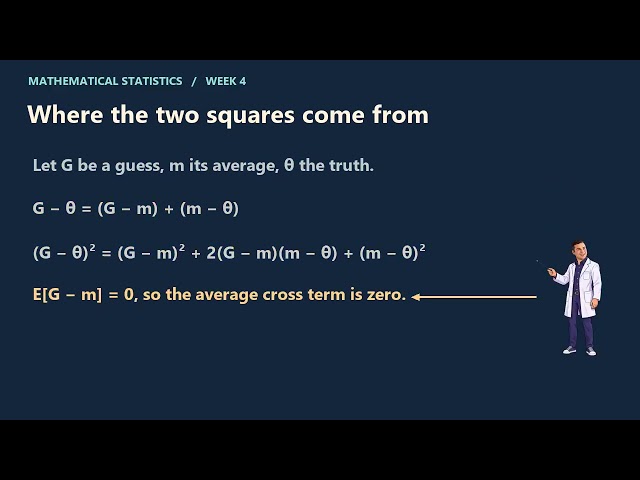
Bias, Variance, and Mean Squared Error | Mathematical Statistics Week 4

Jimmy got the lunch crowd right on average. I still missed lunch. What should we actually score? I work through every possible ...

5:23
Bias, Variance, and Mean Squared Error | Mathematical Statistics Week 4

9 views

14h ago

Learn With Sateesh
Basic Statistics and Gaussian Mixture Models with EM Algorithm | ML Unit 3 Part 4 (JNTUH R22)

Basic statistics and Gaussian mixture models for JNTUH R22 B.Tech CSE (AI&ML), Machine Learning, Unit III, Part 4 of 6. You will ...

12:52
Basic Statistics and Gaussian Mixture Models with EM Algorithm | ML Unit 3 Part 4 (JNTUH R22)

0 views

17h ago

Practical Data Science
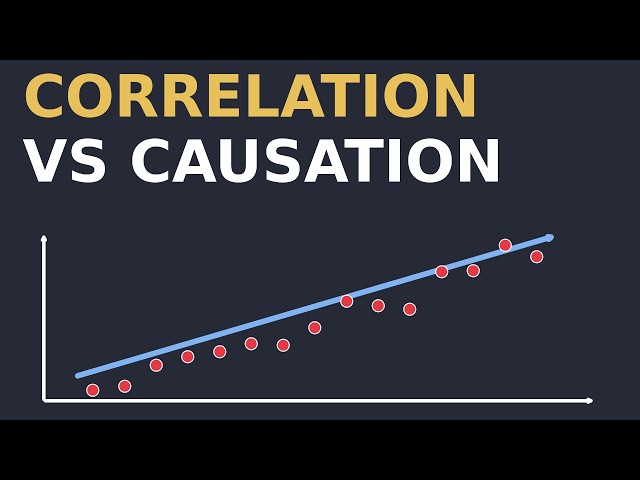
Correlation vs Causation, Made Simple!!!

Correlation vs Causation, Made Simple!!! What is the difference between correlation and causation? Ice cream sales track ...

6:57
Correlation vs Causation, Made Simple!!!

0 views

2h ago

OJHA MATHS @ SCHOLAR ACADEMY
Basic Idea and related facts about Testing of Hypothesis

Writing In this video, we discuss the fundamental concepts of Testing of Hypothesis, an important topic in Probability, Statistics, ...

8:04
Basic Idea and related facts about Testing of Hypothesis

20 views

1d ago

Mash on AI
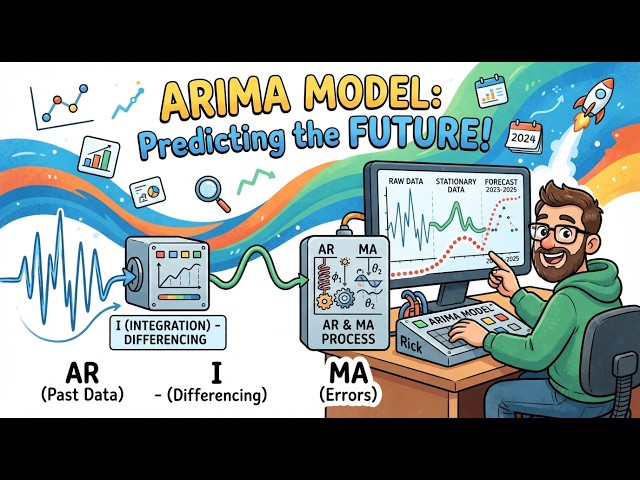
Autoregressive Integrated Moving Average (ARIMA) in Timeseries Analysis

Learn how to use ARIMA to make predictions using timeseries data. Dataset: ...

13:16
Autoregressive Integrated Moving Average (ARIMA) in Timeseries Analysis

3 views

20h ago

SyntaxPilot
Data Analytics Tutorial #39 | P(tea) + P(snack) = 1.3? The rule you're missing

Data Analytics Tutorial: Episode 39 of SyntaxPilot's free Data Analytics full course, with real-life examples for every concept. P(tea) ...

12:48
Data Analytics Tutorial #39 | P(tea) + P(snack) = 1.3? The rule you're missing

0 views

10h ago

Chalkboard Actuary
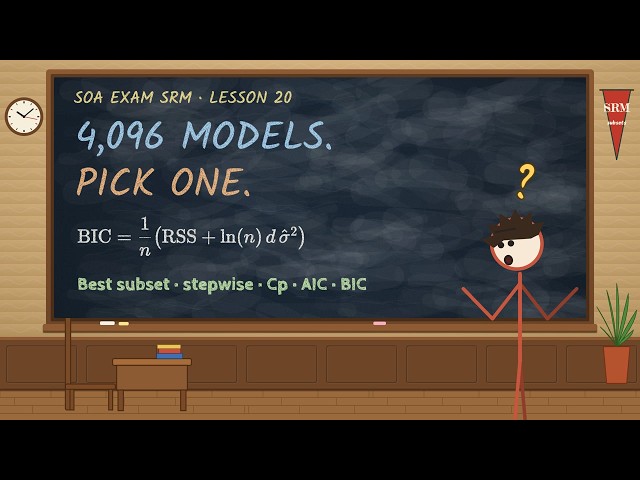
SOA Exam SRM: Best Subset, Stepwise Selection, Cp, AIC, BIC and Cross-Validation (Lesson 20)

Exam SRM Lesson 20 continues learning outcome 2(e) of the SOA Statistics for Risk Modeling syllabus: select an appropriate ...

15:04
SOA Exam SRM: Best Subset, Stepwise Selection, Cp, AIC, BIC and Cross-Validation (Lesson 20)

0 views

19h ago

QauntaFlow
Build an Interactive Dashboard in QauntaFlow Viz Canvas | Lesson 6

In this lesson you'll build an interactive dashboard in Viz Canvas. You'll start from a recommended one, add and edit charts, filter ...

5:06
Build an Interactive Dashboard in QauntaFlow Viz Canvas | Lesson 6

3 views

21h ago

Akhilesh Kumar Singh
Bernoulli-Binomial Probability Distribution | #probability | #statistics | #RStudio | Episode 39

Bernoulli-Binomial Probability Distribution| #probability | #statistics | #RStudio | Episode 39 This channel is "Learn ...

14:50
Bernoulli-Binomial Probability Distribution | #probability | #statistics | #RStudio | Episode 39

32 views

1d ago

Michael Bosnjak, Univ.-Prof. Dr.
Open Science: A Brief Introduction to R

Could you repeat last year's analysis exactly? With R, your script documents every step. This video is a first, gentle introduction for ...

9:28
Open Science: A Brief Introduction to R

20 views

18h ago