ViewTube

ViewTube
Sign inSign upSubscriptions
Filters

Upload date

Type

Duration

Sort by

Features

Reset

260 results

The Data Classroom
Types of Data | Nominal, Ordinal, Discrete and Continuous (NOIR) | FDS Unit 1 Topic 6

Not all data is the same. Nominal, ordinal, discrete and continuous data with simple examples, the quick test for discrete vs ...

11:25
Types of Data | Nominal, Ordinal, Discrete and Continuous (NOIR) | FDS Unit 1 Topic 6

0 views

3h ago

Neha
#2.6 Learn Seaborn Box Plot and Heatmap | Google Play Store Data Analysis

Welcome back to our Google Play Store Data Analysis series! In this video, we continue our hands-on data analysis project using ...

18:19
#2.6 Learn Seaborn Box Plot and Heatmap | Google Play Store Data Analysis

1 view

9h ago

Luke Barousse
Claude Can Build Your Dashboards Now: Full Tutorial

Claude for Data Analytics course https://lukeb.co/claude-da Dataset (DuckDB file) https://lukeb.co/claude-data-files My ...

19:55
Claude Can Build Your Dashboards Now: Full Tutorial

4,993 views

7h ago

Practical Data Science
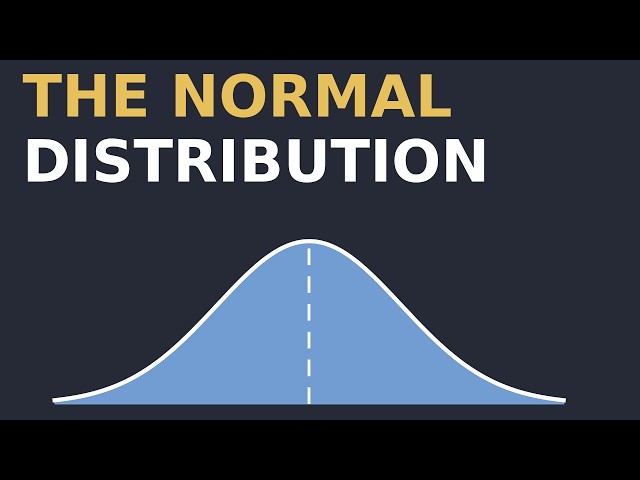
The Normal Distribution, Made Simple!!!

The Normal Distribution, Made Simple!!! What is the normal distribution, and why is the bell curve everywhere? Meet Norm — the ...

7:07
The Normal Distribution, Made Simple!!!

0 views

5h ago

The CS Lab
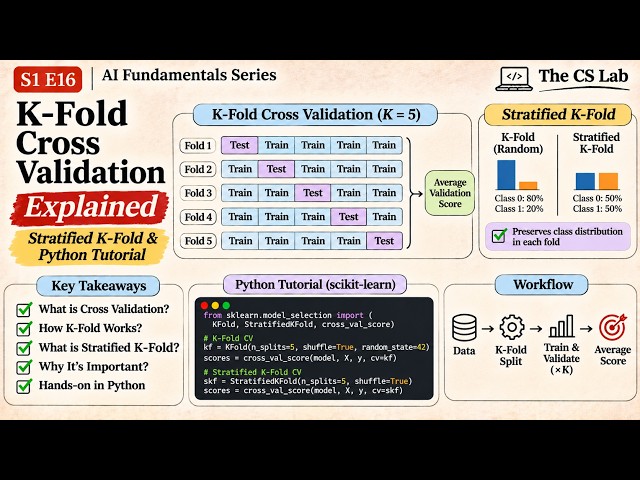
K Fold Cross Validation Explained  Stratified K Fold & Python Tutorial  Machine Learning S1E16

#MachineLearning #CrossValidation #KFold #StratifiedKFold #ScikitLearn #Python #GridSearchCV #DataScience #TheCSLab.

6:39
K Fold Cross Validation Explained Stratified K Fold & Python Tutorial Machine Learning S1E16

3 views

8h ago

Codonut
Learn Tuples in Python for Beginners [PART 39]

Master tuples in Python [PART 39] to store, protect, and manage immutable collections of data like a pro! Want to understand ...

9:16
Learn Tuples in Python for Beginners [PART 39]

1 view

9h ago

Data Tutorials
Power BI DAX CALCULATE Function Explained | Beginner to Advanced (2027) #dax #powerbi

dax #powerbi #dataanalysis PACKAGED COURSES ✓ Power BI + SQL + Python + Fabric + Projects Course ...

12:03
Power BI DAX CALCULATE Function Explained | Beginner to Advanced (2027) #dax #powerbi

471 views

9h ago

U.S. Census Bureau
DATE GEM: Navigate the U.S. Economy with the 2024 AIES Interactive Tool

#CensusAcademy #DataGems #DataTools #DataVisualization #datascience #population #dataanalysis #economy #employment ...

4:54
DATE GEM: Navigate the U.S. Economy with the 2024 AIES Interactive Tool

119 views

22h ago

Geek's Lesson
Confidence Intervals Explained: What "95% Confident" Really Means

... confidence level vs width, how sample size shrinks the interval, polls' ± 3%, the t distribution and the bootstrap for data science.

10:06
Confidence Intervals Explained: What "95% Confident" Really Means

822 views

7h ago

Orchid Scientific and Innovative India Pvt. Ltd.
Trackezi 7 Full Software Walkthrough – Multi-Arena Animal Behavior Tracking, ROI Setup & Data Export

See Trackezi 7 in complete action — from experiment setup to final data export. This in-depth demonstration walks through every ...

7:28
Trackezi 7 Full Software Walkthrough – Multi-Arena Animal Behavior Tracking, ROI Setup & Data Export

3 views

15h ago

Tech Info With Eshan (IIT Madras)
NumPy for Machine Learning | Python NumPy Tutorial | Lecture 9 | Eshan Shekhar

Welcome to Lecture 9 of the Hands-On Machine Learning with Scikit-Learn series on Tech Info With Eshan! In this lecture, we ...

6:02
NumPy for Machine Learning | Python NumPy Tutorial | Lecture 9 | Eshan Shekhar

17 views

6h ago

LearnerMap
Learn Data Analytics for Free | 3 Best FREE Data Analytics Courses with Certification

🔥 Become a Data Analyst in 2025 – Complete Course in Hindi (With Job Support!) 👉 https://www.skillsiya.com/courses/Complete ...

9:27
Learn Data Analytics for Free | 3 Best FREE Data Analytics Courses with Certification

276 views

8h ago

Hot Hot Math
Week 12 Live Lecture  Intro to Statistics MAT125 Joyce

Get 30 did I do that right let's do it again 4 + 5 is 9 13 19 25 29 30 Yeah okay so it said we have 30 uh sets of data 30 pieces of ...

19:06
Week 12 Live Lecture Intro to Statistics MAT125 Joyce

8 views

1d ago

WiredWhite
Ant Colony Optimization (ACO) for Traveling Salesman Problem in MATLAB

The Traveling Salesman Problem (TSP) is a classic NP-hard combinatorial optimization challenge with applications in logistics ...

10:05
Ant Colony Optimization (ACO) for Traveling Salesman Problem in MATLAB

0 views

3h ago

Math Visualized
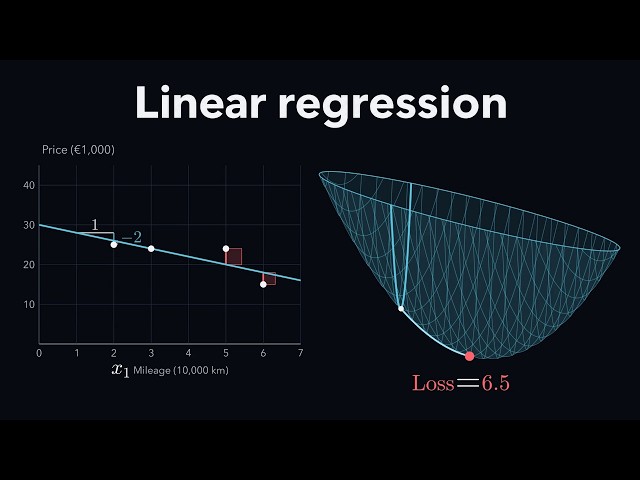
Linear Regression: Finding the Best Line

How do we find the best line through a scatterplot? This animated introduction to linear regression uses used-car sales to show ...

6:55
Linear Regression: Finding the Best Line

8 views

5h ago

The Orange WorkFlow
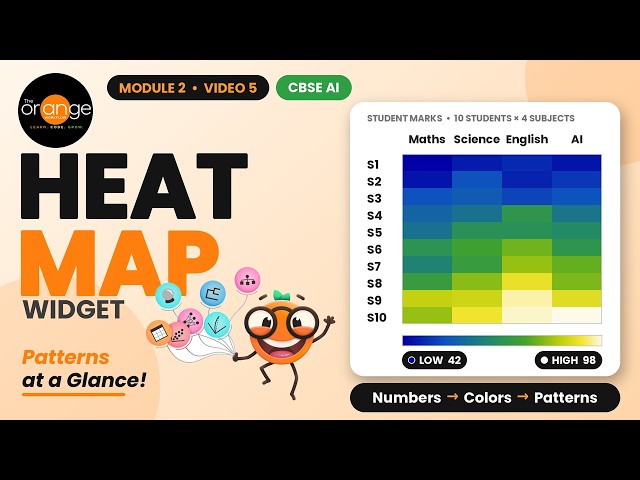
Heat Map Widget in Orange Data Mining | Data Visualization Tutorial | No Coding | Module 2 Video 5

CBSE Class 10 & 12 Artificial Intelligence students, college students, Data Science beginners, teachers, and anyone learning ...

15:26
Heat Map Widget in Orange Data Mining | Data Visualization Tutorial | No Coding | Module 2 Video 5

6 views

5h ago

bagusco bagusco
week #12   Introduction to Regression Tree v2   English

assisted by Gemini and Clipchamp statistics and data science program IPB University.

9:49
week #12 Introduction to Regression Tree v2 English

20 views

10h ago

Bhaskar Berry
Ep 10: Azure Data Factory | Copy CSV Files Between Folders in ADLS Gen2 Using Copy Data Activity

we'll learn how to copy a CSV file from one folder to another within Azure Data Lake Storage Gen2 using the Copy Data activity.

14:31
Ep 10: Azure Data Factory | Copy CSV Files Between Folders in ADLS Gen2 Using Copy Data Activity

12 views

10h ago

Supply Science
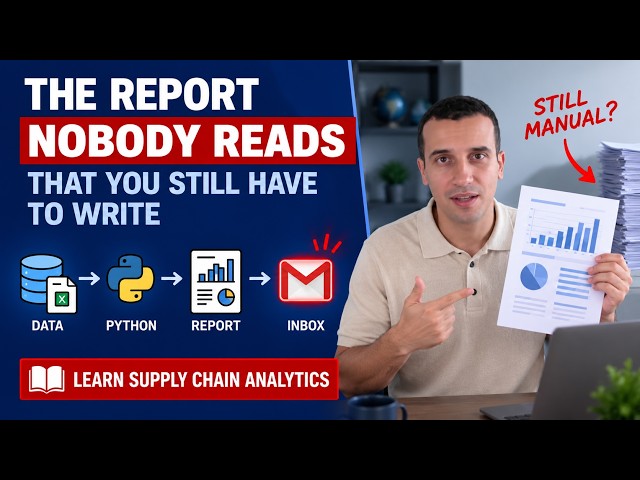
Automate Your Weekly Supply Chain Report Without AI

Automated reporting in Python assembles the weekly supply chain report from HTML components: a banner, a KPI summary, ...

5:06
Automate Your Weekly Supply Chain Report Without AI

91 views

14h ago

Taro Ch. 東村山タロウ
[DS Certification] Data Engineering "Data Infrastructure ①" A Thorough Explanation of the Critica...

Thank you for watching! Please subscribe to our channel! ✨ 📌 Timestamps 00:00 Opening (Data Storage ① -- DWH × Distributed ...

5:47
[DS Certification] Data Engineering "Data Infrastructure ①" A Thorough Explanation of the Critica...

55 views

11h ago