Upload date
All time
Last hour
Today
This week
This month
This year
Type
All
Video
Channel
Playlist
Movie
Duration
Short (< 4 minutes)
Medium (4-20 minutes)
Long (> 20 minutes)
Sort by
Relevance
Rating
View count
Features
HD
Subtitles/CC
Creative Commons
3D
Live
4K
360°
VR180
HDR
215,279 results
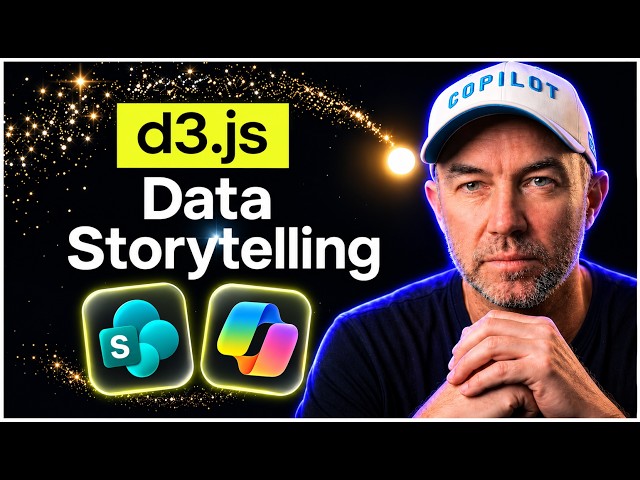
D3.js has landed in the SharePoint sandbox, and Copilot in SharePoint can now use it to build views that tell a story about your ...
1,188 views
5h ago
Start building powerful data visualizations in Python! In Lesson 1 of our Matplotlib series, we cover everything you need to know to ...
15 views
2w ago
Try Claude Code yourself https://clau.de/ThuVu Git repo for this demo ...
207,366 views
13d ago
Catch up on everything new in Microsoft Fabric for November 2026. Get a quick rundown of this month's updates and see the new ...
7,620 views
1d ago
Catch up on everything new in Power BI for November 2026. Get a quick rundown of this month's updates, see the new features in ...
27,576 views
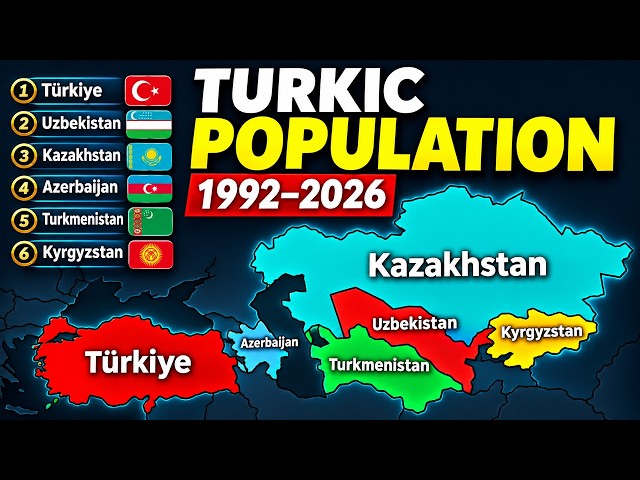
... #PopulationComparison #BarChartRace #DataVisualization #Turkey #Uzbekistan #Kazakhstan #Azerbaijan #Turkmenistan ...
18,415 views
This tutorial is for anyone looking to improve their data visualization efficiency. We cover the setup process and show how to ...
780 views
6 Data Visualization Principles Every Data Scientist Should Know | Better Dashboards Explained Why are some dashboards ...
155 views
4w ago
Hello everyone, this is professor Knox, and this lecture is titled – Data Visualization in the Social Sciences. Data visualization is ...
148 views
Learn how SAP Analytics Cloud (SAC) helps businesses analyze data using interactive dashboards, data visualization, charts, ...
82 views
ClaudeAI #ClaudeDashboards #Dashboards #DataVisualisation #Excel #ExcelTips #AIAutomation #DataAnalytics ...
1,024 views
3w ago
What is Data Visualization, and why is it important in Data Analytics? In this video, learn how complex data can be converted ...
33 views
11d ago
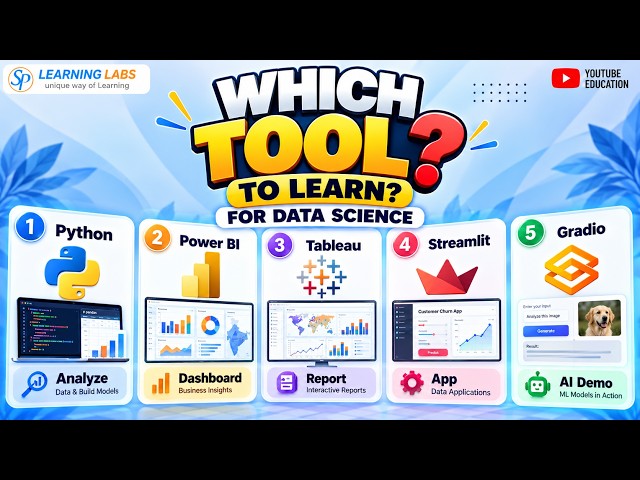
Which Data Visualization tool should you learn for Data Science? Python, Power BI, Tableau, Streamlit, Gradio — each tool solves ...
28 views
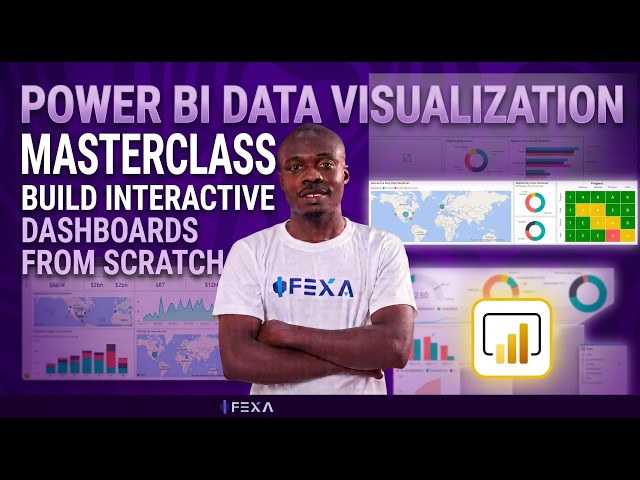
In this lesson, we take a practical approach to Data Visualization using Microsoft Power BI. After learning data cleaning, data ...
369 views
Streamed 2w ago
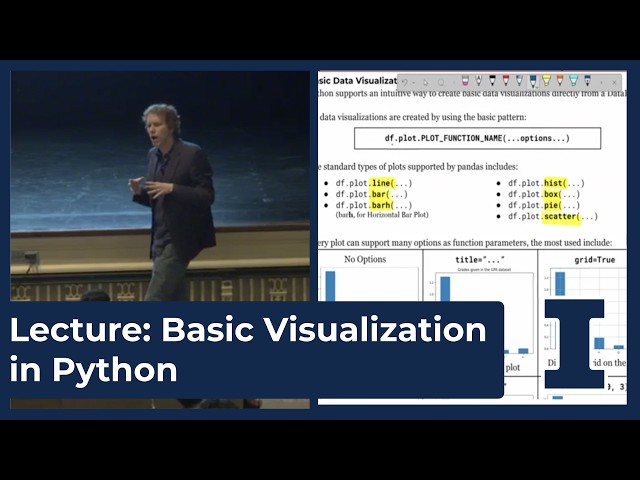
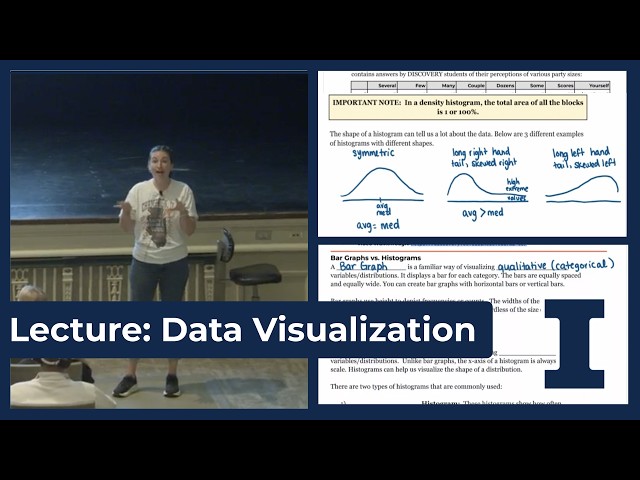
Want to learn more about Data Science? Head over to https://discovery.cs.illinois.edu/ to get started!
12 views
In data science, we often work with large amounts of numerical data. Looking at rows and columns of numbers can make it difficult ...
5 views
2d ago
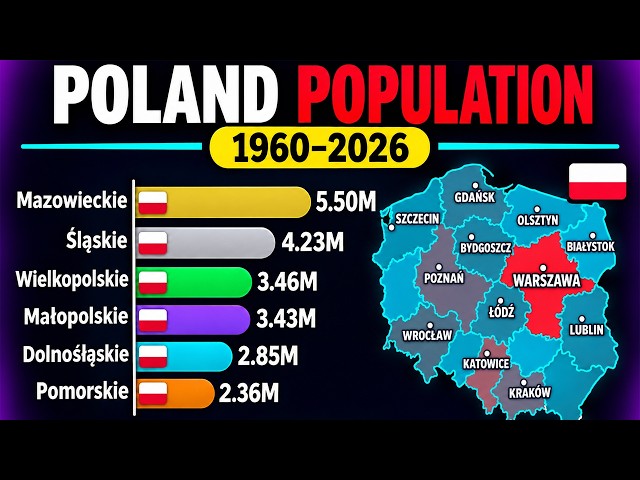
... #BarChartRace #Population #Demographics #PopulationGrowth #DataVisualization #PolandHistory #Statistics #InfoZoom.
5,255 views
13 views
How to improve the formatting of a chart in excel.
444 views
Impact Studio's 26-27 graphic design intern, Ninabelle Mullins, talks about the basics of data visualization and graphic design.