Upload date
All time
Last hour
Today
This week
This month
This year
Type
All
Video
Channel
Playlist
Movie
Duration
Short (< 4 minutes)
Medium (4-20 minutes)
Long (> 20 minutes)
Sort by
Relevance
Rating
View count
Features
HD
Subtitles/CC
Creative Commons
3D
Live
4K
360°
VR180
HDR
633 results
D3.js has landed in the SharePoint sandbox, and Copilot in SharePoint can now use it to build views that tell a story about your ...
1,188 views
5h ago
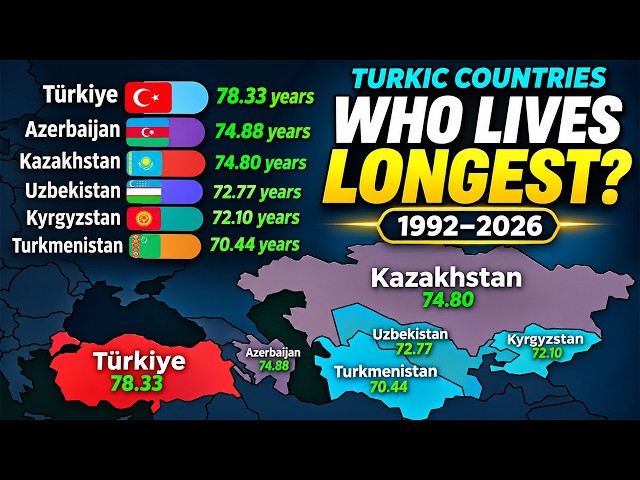
... both sexes combined #LifeExpectancy #TurkicCountries #Longevity #BarChartRace #DataVisualization #CountryComparison ...
2,094 views
9h ago
This tutorial is for anyone looking to improve their data visualization efficiency. We cover the setup process and show how to ...
812 views
Imagine a single megacity housing the entire human race. How big would it be — and where could it fit? We use real population ...
0 views
21h ago
In this lesson: the Platform Analytics experience, data visualizations and their types, dashboards and how to share and certify ...
3h ago
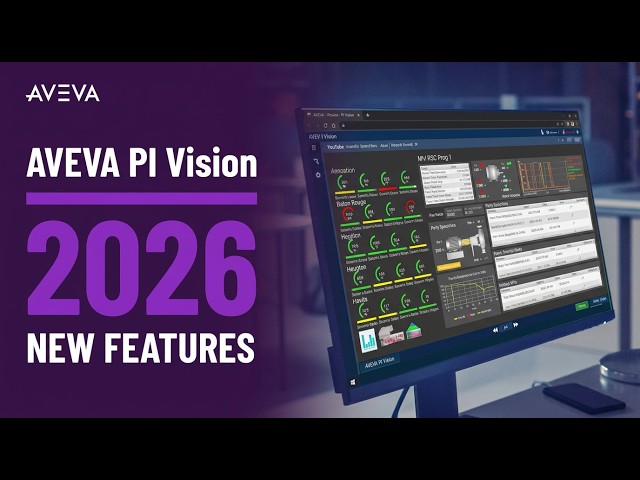
PI Vision 2026 Release Notes: https://docs.aveva.com/bundle/pi-vision/page/1642097.html ------ Continue learning at ...
1,251 views
15h ago
Learn data visualization in plain Python covering scales, axes, breaks, and ticks. You build a linear axis, a log axis with powers of ...
1 view
14h ago
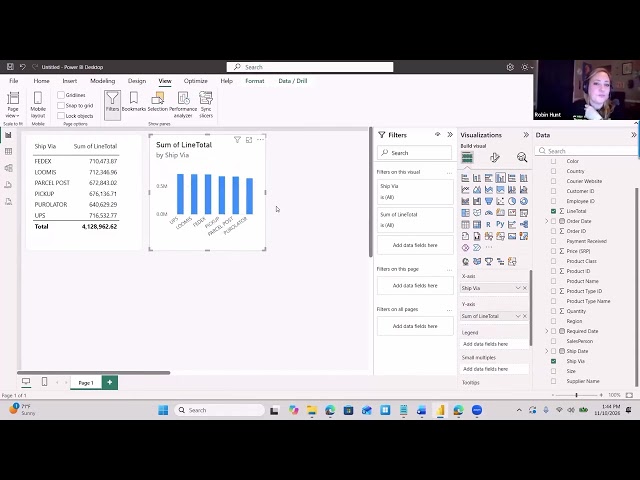
Not sure which visualization to use in Power BI? You're not alone! In this lesson, Robin Hunt demonstrates how to start with the ...
7 views
7h ago
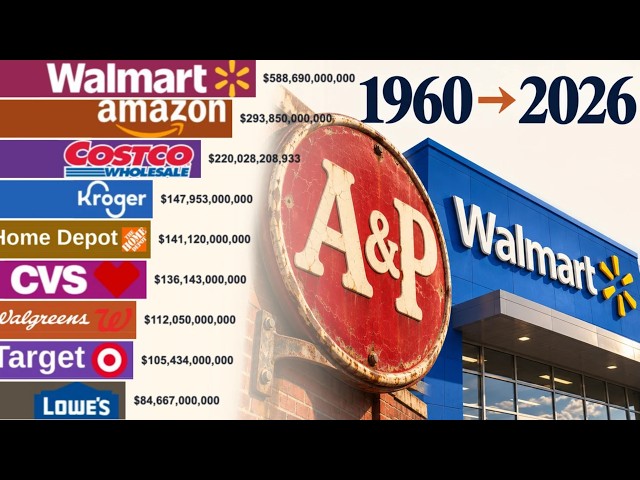
This animated data visualization tracks the financial performance of iconic chains, from the rise of Kmart and the expansion of ...
1,382 views
8h ago
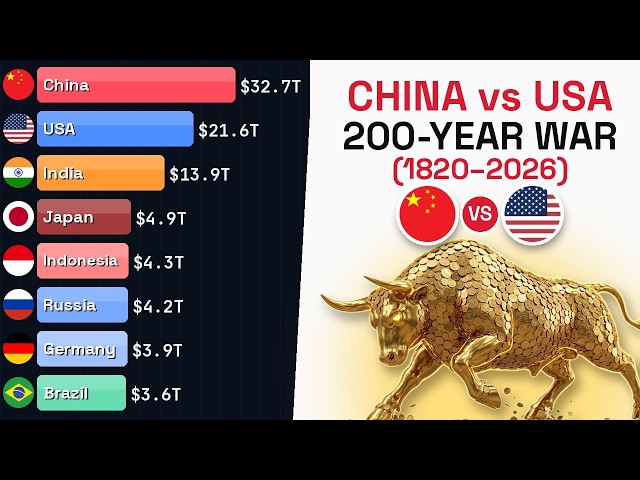
Which country ruled the world economy? Watch 200 years of GDP — from Qing China's dominance to the rise of the United States ...
22 views
22h ago
... 2:54 The 1990s 3:53 The 2000s 4:51 The 2010s 5:58 The 2020s 6:44 What it all means #economy #gdp #datavisualization.
2 views
10h ago
Designed to simplify data visualization, this widget helps businesses turn numbers and performance data into clear, engaging, ...
5 views
Novo Nordisk and Rockwell Automation will come together for an engaging discussion on how a modern, centralised approach to ...
53 views
Streamed 7h ago
We explore two important data visualization techniques — Box Plot and Heatmap — to understand data distribution, identify ...
3 views
13h ago
Heat Map Widget in Orange Data Mining | Data Visualization Tutorial | No Coding Can you analyze 400 numbers in just a few ...
9 views
#ClaudeAI #NoDashboard #AIDashboard #DataAnalytics #AITools2026 #NoCoding #DataVisualization #ClaudeAITutorial.
97 views
12h ago
On 1 October 2015 the U.S. cargo ship El Faro sank in Hurricane Joaquin with all 33 aboard. In August 2016 a U.S. Navy robot, ...
1,939 views
Presenting an overcrowded dashboard that dumps five years of raw operational data onto a single screen does not help executive ...
8 views
Data Analytics Tutorial: Episode 31 of SyntaxPilot's free Data Analytics full course, with real-life examples for every concept.
6h ago
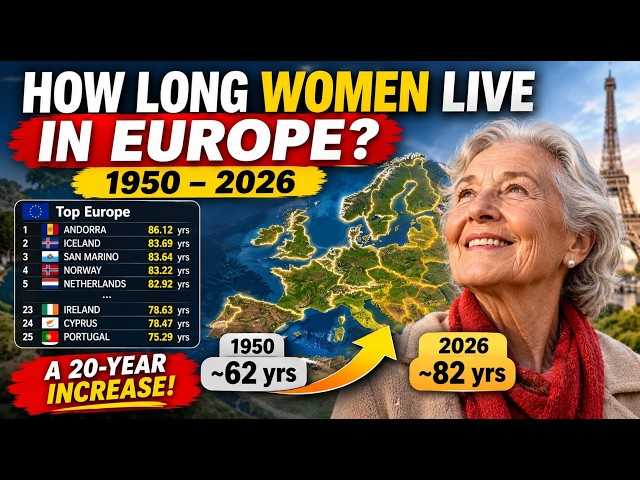
This data visualization ranks European countries by *female life expectancy at birth*, showing how many years a newborn girl is ...