Upload date
All time
Last hour
Today
This week
This month
This year
Type
All
Video
Channel
Playlist
Movie
Duration
Short (< 4 minutes)
Medium (4-20 minutes)
Long (> 20 minutes)
Sort by
Relevance
Rating
View count
Features
HD
Subtitles/CC
Creative Commons
3D
Live
4K
360°
VR180
HDR
98,689 results
D3.js has landed in the SharePoint sandbox, and Copilot in SharePoint can now use it to build views that tell a story about your ...
1,107 views
4h ago
This tutorial is for anyone looking to improve their data visualization efficiency. We cover the setup process and show how to ...
688 views
5h ago
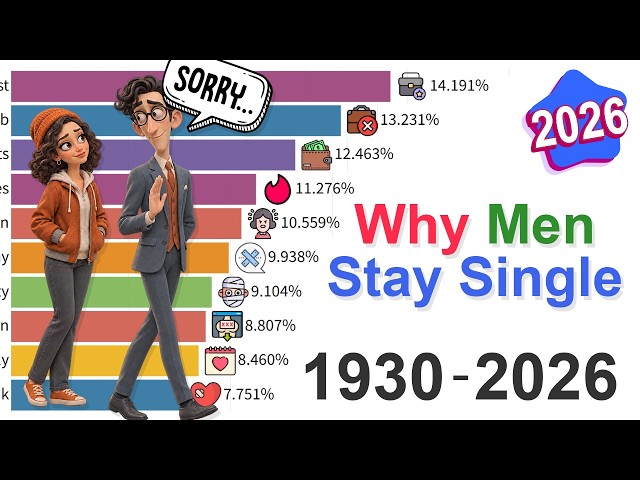
In this visualization I track the reasons men stay single in the United States from 1930 to 2026, focusing on men aged 25 - 44.
123,043 views
3d ago
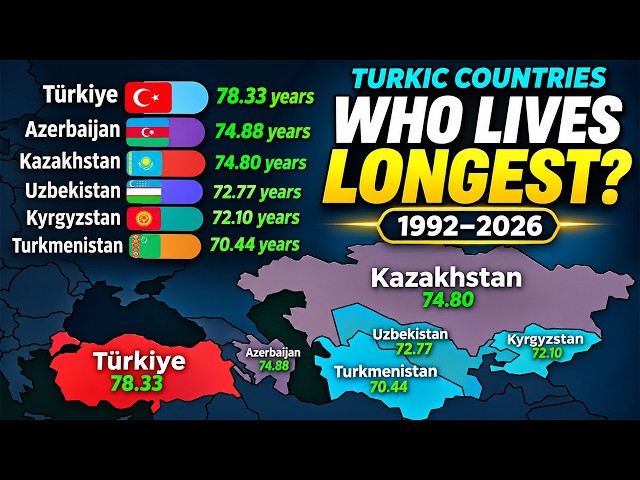
... both sexes combined #LifeExpectancy #TurkicCountries #Longevity #BarChartRace #DataVisualization #CountryComparison ...
2,023 views
8h ago
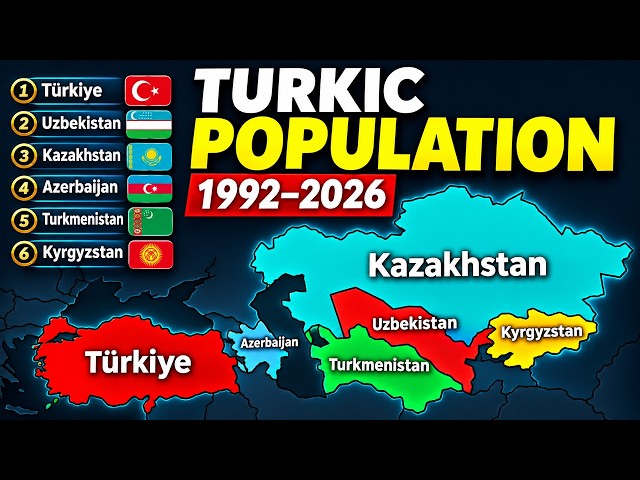
... #PopulationComparison #BarChartRace #DataVisualization #Turkey #Uzbekistan #Kazakhstan #Azerbaijan #Turkmenistan ...
18,256 views
1d ago
In this lesson: the Platform Analytics experience, data visualizations and their types, dashboards and how to share and certify ...
0 views
2h ago
Catch up on everything new in Microsoft Fabric for November 2026. Get a quick rundown of this month's updates and see the new ...
7,543 views
Catch up on everything new in Power BI for November 2026. Get a quick rundown of this month's updates, see the new features in ...
27,358 views
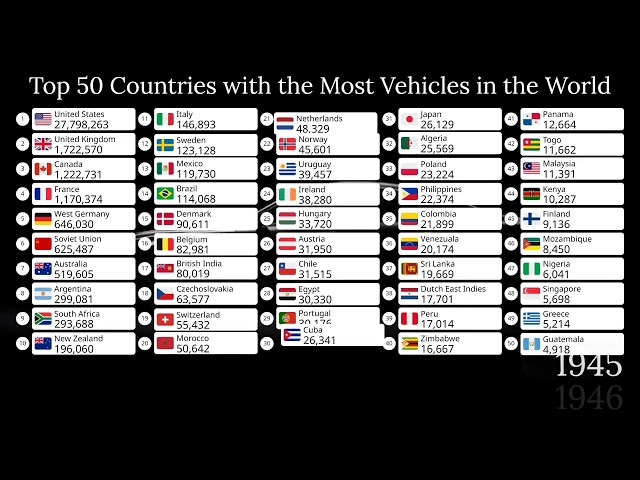
... automotive history, transportation, geography, economics, country rankings, infrastructure, and historical data visualizations.
3,836 views
18h ago
Imagine a single megacity housing the entire human race. How big would it be — and where could it fit? We use real population ...
20h ago
Visualization is more than just imagining what you want. In this video, I share a realization that completely changed how I ...
16,796 views
2d ago
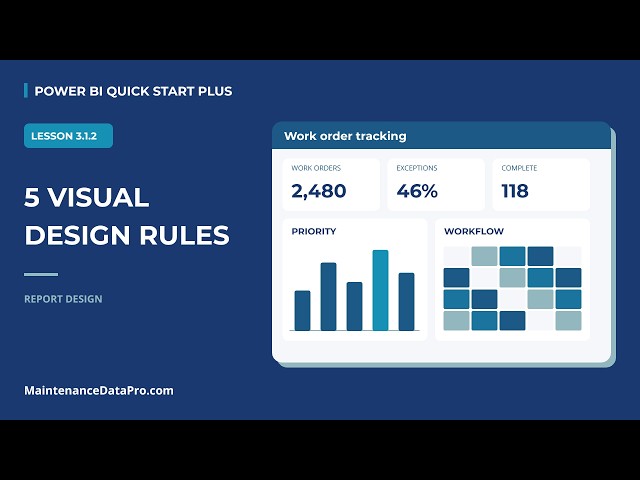
Understand the principles of effective data visualization and how to choose the right visual for their needs. Lesson 3.1.2 | Power BI ...
7 views
4d ago
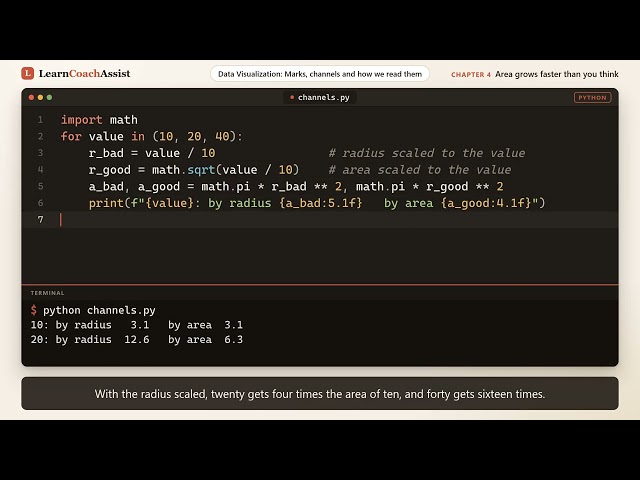
Learn data visualization in Python by exploring marks and channels, ranked by accuracy. You will build a dot plot, a text scatter ...
5d ago
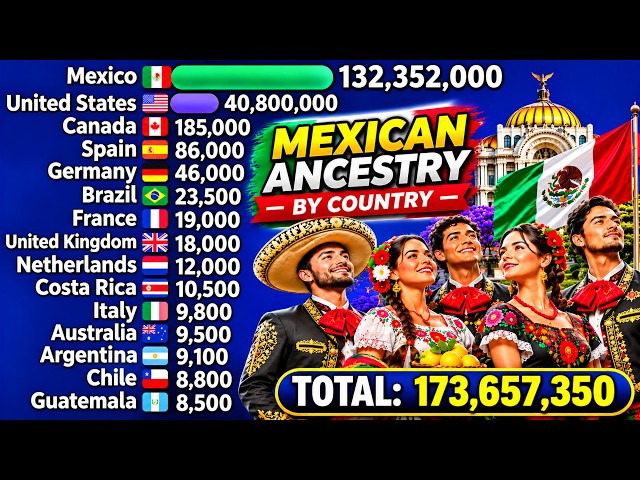
Data visualization: 1900–2026 Countries: Worldwide Topic: Mexican ancestry and population history Subscribe for more ...
277 views
6d ago
Learn data visualization in plain Python covering scales, axes, breaks, and ticks. You build a linear axis, a log axis with powers of ...
1 view
14h ago
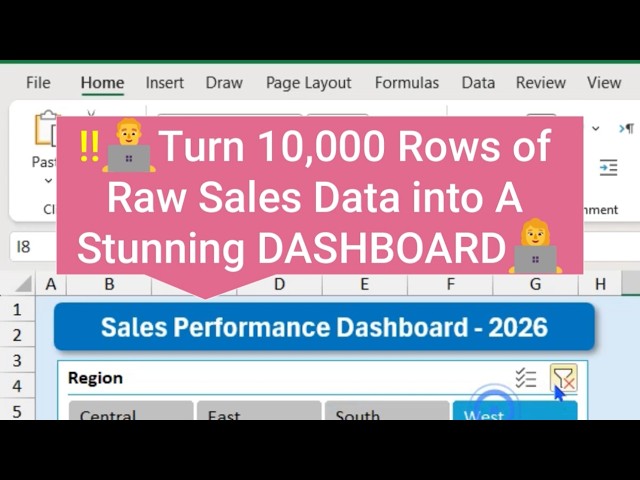
... dynamically (full tutorial) #exceldashboard #dynamicdashboard #interactivedashboard #excel #exceltutorial #datavisualization.
105 views
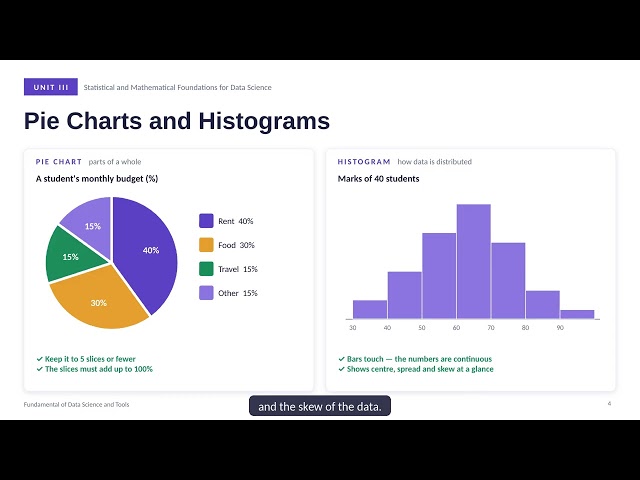
In data science, we often work with large amounts of numerical data. Looking at rows and columns of numbers can make it difficult ...
5 views
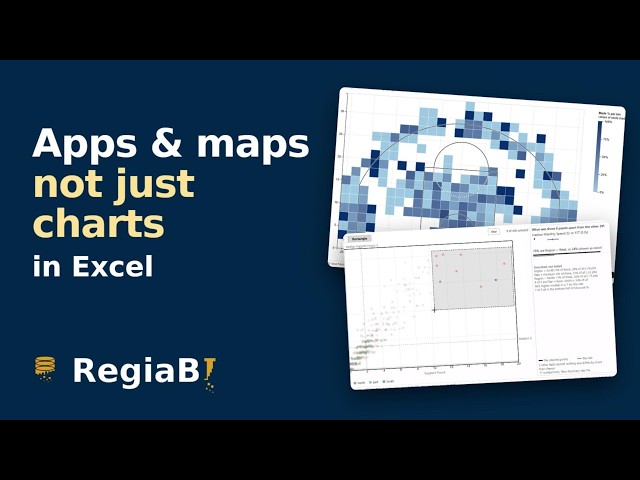
... MCP: https://claude.ai/directory/regiabi-charts Site: https://bizintelligencechampions.com #Excel #PowerBI #datavisualization.
3,984 views
The question you are asking decides the chart you should draw. Bar, line, pie, histogram, scatter and box plots explained with ...
8 views
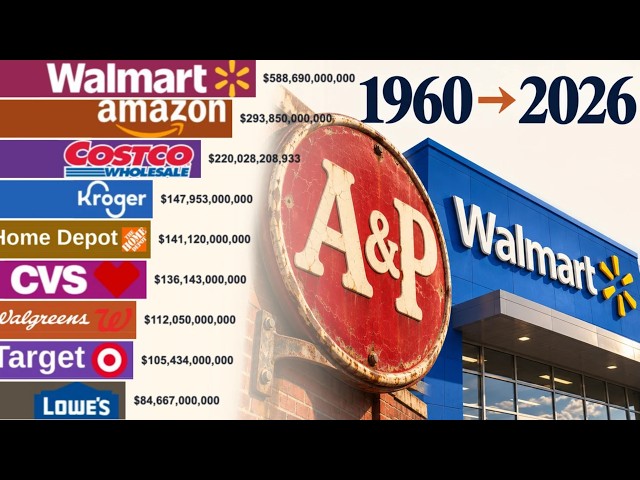
This animated data visualization tracks the financial performance of iconic chains, from the rise of Kmart and the expansion of ...
1,268 views