Upload date
All time
Last hour
Today
This week
This month
This year
Type
All
Video
Channel
Playlist
Movie
Duration
Short (< 4 minutes)
Medium (4-20 minutes)
Long (> 20 minutes)
Sort by
Relevance
Rating
View count
Features
HD
Subtitles/CC
Creative Commons
3D
Live
4K
360°
VR180
HDR
247 results
Learn Matplotlib with Coding Kitty! Create line, bar, and scatter plots, histograms, and pie charts. Discover how to customize colors ...
1 view
1d ago
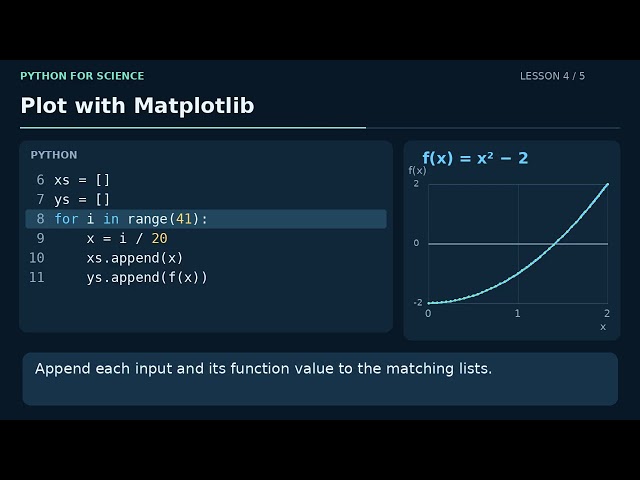
Lesson 4 of 5 in Python for Science. Plot a Function with Matplotlib. Follow the code and its result using f(x) = x² − 2. English ...
0 views
3d ago
Part 7 of AI Masterclass: Data + Math. Draw the four charts that explain most data (histogram, scatter plot, box plot, bar chart) with ...
2 views