Upload date
All time
Last hour
Today
This week
This month
This year
Type
All
Video
Channel
Playlist
Movie
Duration
Short (< 4 minutes)
Medium (4-20 minutes)
Long (> 20 minutes)
Sort by
Relevance
Rating
View count
Features
HD
Subtitles/CC
Creative Commons
3D
Live
4K
360°
VR180
HDR
13,554 results
Learn Matplotlib with Coding Kitty! Create line, bar, and scatter plots, histograms, and pie charts. Discover how to customize colors ...
1 view
1d ago
Yaar sach batao… kabhi aisa laga hai ki data dekh ke kuch samajh hi nahi aata? Numbers hi numbers… aur dimaag full ...
230 views
6mo ago
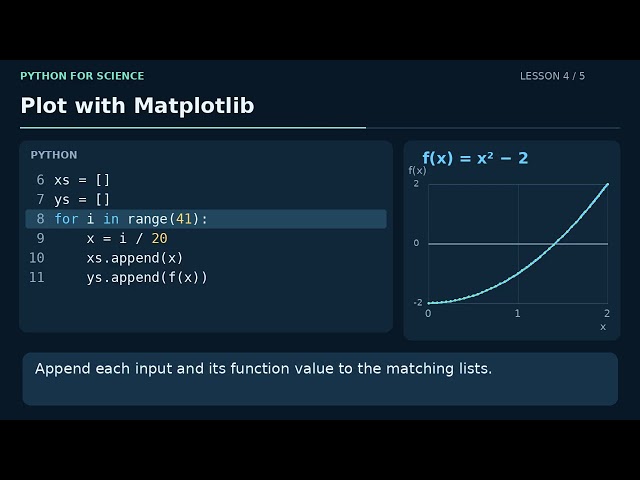
Lesson 4 of 5 in Python for Science. Plot a Function with Matplotlib. Follow the code and its result using f(x) = x² − 2. English ...
0 views
3d ago
Part 7 of AI Masterclass: Data + Math. Draw the four charts that explain most data (histogram, scatter plot, box plot, bar chart) with ...
2 views