Upload date
All time
Last hour
Today
This week
This month
This year
Type
All
Video
Channel
Playlist
Movie
Duration
Short (< 4 minutes)
Medium (4-20 minutes)
Long (> 20 minutes)
Sort by
Relevance
Rating
View count
Features
HD
Subtitles/CC
Creative Commons
3D
Live
4K
360°
VR180
HDR
3,011,151 results
Welcome to the Looker Tutorial. This comprehensive Looker Course is designed to take you from a complete beginner to a data ...
10,068 views
8mo ago
Micrososft Azure - Data Analyst Course ...
4,414 views
4mo ago
Couse website: https://gispro-fall26.gishub.org --------------------------------------------------------- More Resources: Get My Books on ...
1,364 views
9d ago
48-HOUR BLACK FRIDAY BONUS 50% off Maven Pro Lifetime Plus deals on monthly + annual plans: https://bit.ly/4kvotxf ...
9,093 views
10mo ago
4,922 views
3mo ago
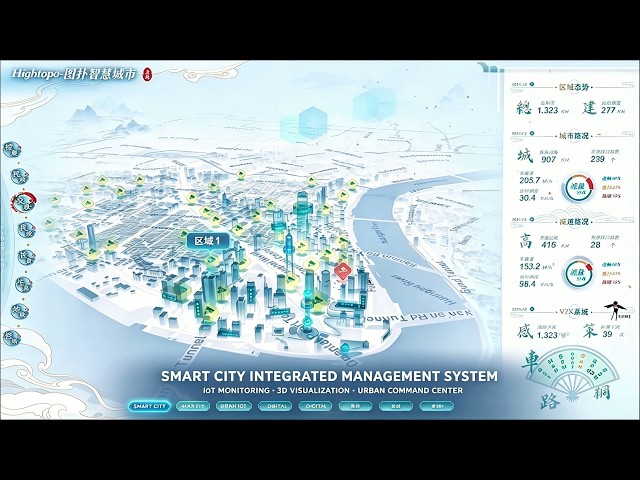
Explore Hightopo's GIS Smart City Digital Twin, bringing digital twin technology, SCADA configuration monitoring, and data ...
432 views
1mo ago
Why do some maps and graphs keep millions of people watching? And what can data visualization practitioners learn from ...
863 views
2mo ago
Get full-featured, no-cost JMP software for academic use at https://www.jmp.com/student. Get the JMP files from the webinar and ...
544 views
1,493 views
9mo ago
Nano Banana + Gemini 3: The Data Visualization Workflow You Need | Stop Making Boring Charts – Use This Nano Banana + ...
28,296 views
11mo ago
Catch up on everything new in Power BI for November 2026. Get a quick rundown of this month's updates, see the new features in ...
43,854 views
2d ago
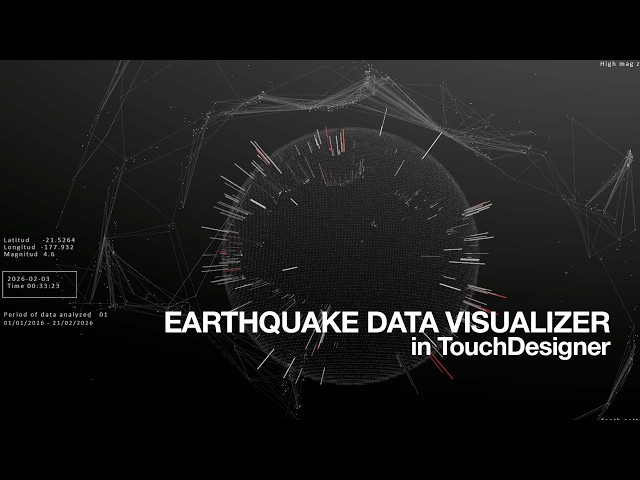
In this tutorial I rebuild my earthquake visualization project from scratch, using real data from the USGS earthquake database.
1,625 views
3w ago
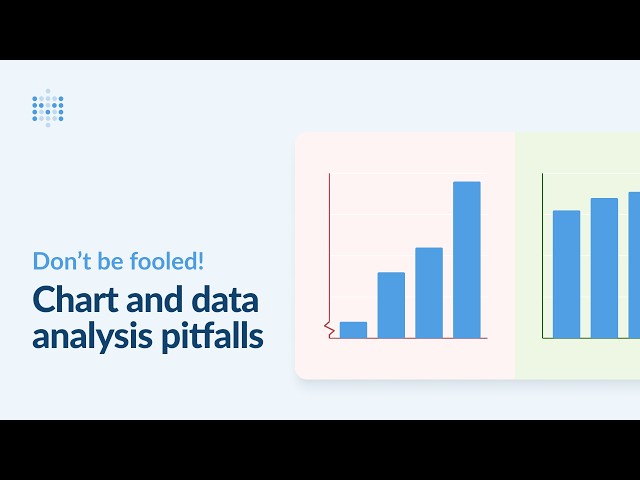
Learn how different chart types can be misleading, and why it's important to dig into data breakdowns. We cover common issues ...
662 views
To learn for free on Brilliant, go to https://brilliant.org/techwithtim . Brilliant's also given our viewers 20% off an annual Premium ...
78,408 views
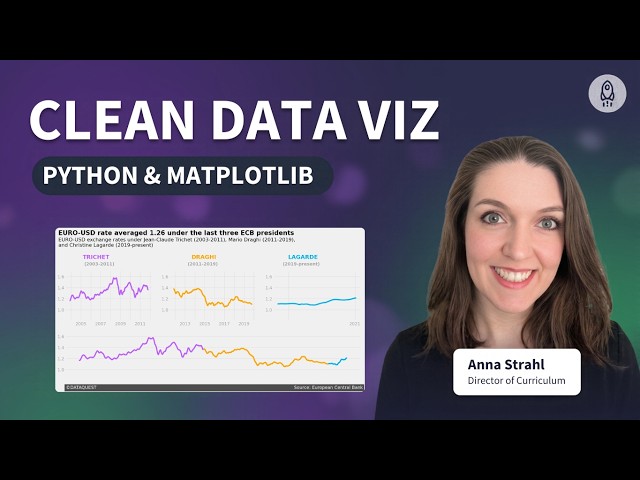
Build a clean, multi-panel data visualization in Python using pandas and matplotlib. This walkthrough takes a raw European ...
960 views
2w ago
MENTORSHIP - Apply to work with me here → https://go.theanalyticsaccelerator.com/yt43 NEWSLETTER - Get practical tips on ...
34,881 views
This video today is a crash course on Seaborn, a data visualization library for Python built on top of Matplotlib. It makes it super ...
28,634 views
How to build a data visualization in R from raw data to a finished chart: read the dataset first, set up a project with the packages ...
1,340 views
Amanda Shendruk is an award-winning visual journalist who's spent 15 years making charts for the Washington Post, Quartz and ...
1,268 views
Learn Matplotlib from scratch in this complete beginner-friendly Python tutorial covering everything from basic plots to professional ...
539 views
5mo ago