Upload date
All time
Last hour
Today
This week
This month
This year
Type
All
Video
Channel
Playlist
Movie
Duration
Short (< 4 minutes)
Medium (4-20 minutes)
Long (> 20 minutes)
Sort by
Relevance
Rating
View count
Features
HD
Subtitles/CC
Creative Commons
3D
Live
4K
360°
VR180
HDR
235,945 results
Catch up on everything new in Power BI for November 2026. Get a quick rundown of this month's updates, see the new features in ...
42,840 views
2d ago
D3.js has landed in the SharePoint sandbox, and Copilot in SharePoint can now use it to build views that tell a story about your ...
3,181 views
1d ago
... Influencers,Power BI Decomposition Tree,Power BI Smart Narrative,Power BI Q&A Visual,Power BI Data Visualization,Power BI ...
1,657 views
22h ago
The course also covers statistics, data visualization, dashboard building, and AI-powered analytics so you can turn raw data into ...
11,604 views
Enquiry: https://forms.gle/dhZhETccxuQTCBQB9 Learn Matplotlib in Python from scratch with this complete beginner-friendly ...
95 views
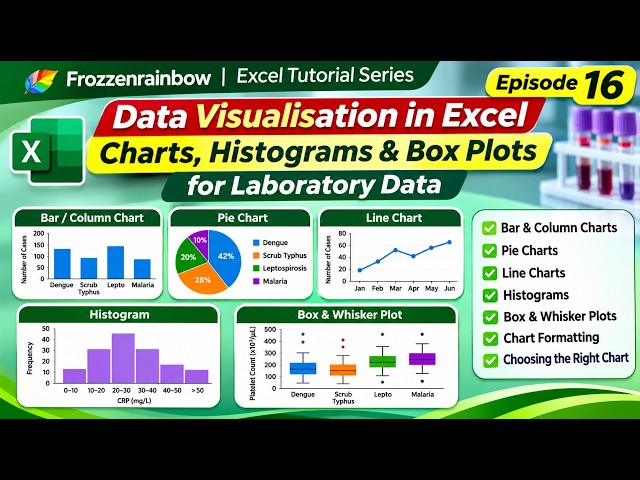
Welcome to Episode 16 of the Frozzenrainbow Excel Tutorial Series! We are now entering the next phase of our Excel learning ...
69 views
6d ago
In this lesson, build on visualization fundamentals by exploring advanced ways to present complex datasets and relationships.
4 views
Discover the fundamentals of Data Visualization with Coding Kitty! Learn why visualization matters, explore different data types ...
3 views
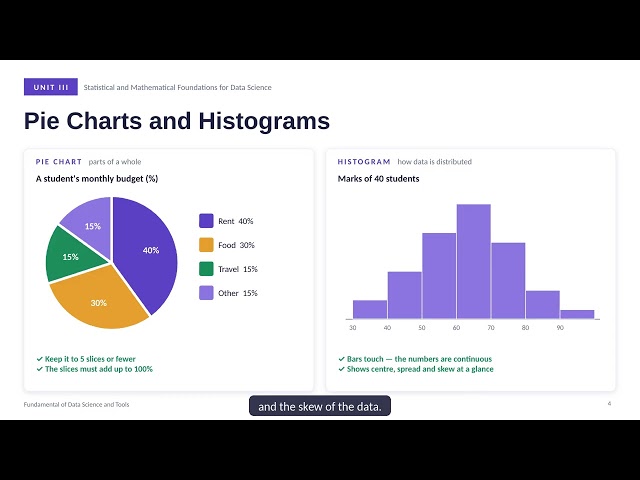
The question you are asking decides the chart you should draw. Bar, line, pie, histogram, scatter and box plots explained with ...
8 views
3d ago