Upload date
All time
Last hour
Today
This week
This month
This year
Type
All
Video
Channel
Playlist
Movie
Duration
Short (< 4 minutes)
Medium (4-20 minutes)
Long (> 20 minutes)
Sort by
Relevance
Rating
View count
Features
HD
Subtitles/CC
Creative Commons
3D
Live
4K
360°
VR180
HDR
312,680 results
The course also covers statistics, data visualization, dashboard building, and AI-powered analytics so you can turn raw data into ...
11,522 views
1d ago
Try Claude Code yourself https://clau.de/ThuVu Git repo for this demo ...
209,366 views
2w ago
FREE CODE & DATASET AVAILABLE ON Official 5 Minutes Engineering Whatsapp Channel Description ...
6,538 views
3w ago
D3.js has landed in the SharePoint sandbox, and Copilot in SharePoint can now use it to build views that tell a story about your ...
3,143 views
Catch up on everything new in Power BI for November 2026. Get a quick rundown of this month's updates, see the new features in ...
42,521 views
2d ago
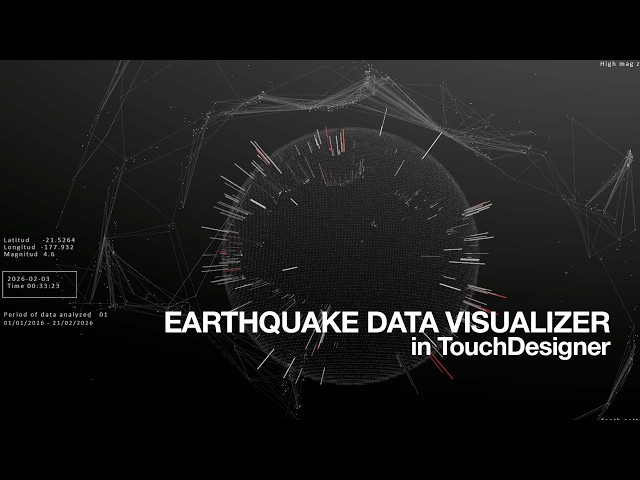
In this tutorial I rebuild my earthquake visualization project from scratch, using real data from the USGS earthquake database.
1,624 views
Couse website: https://gispro-fall26.gishub.org --------------------------------------------------------- More Resources: Get My Books on ...
1,362 views
9d ago
Learn how to transform raw data into clear, meaningful, and actionable business insights with *The Big Book of Dashboards: ...
36 views