ViewTube

ViewTube
Sign inSign upSubscriptions
Filters

Upload date

Type

Duration

Sort by

Features

Reset

992 results

NathCorp
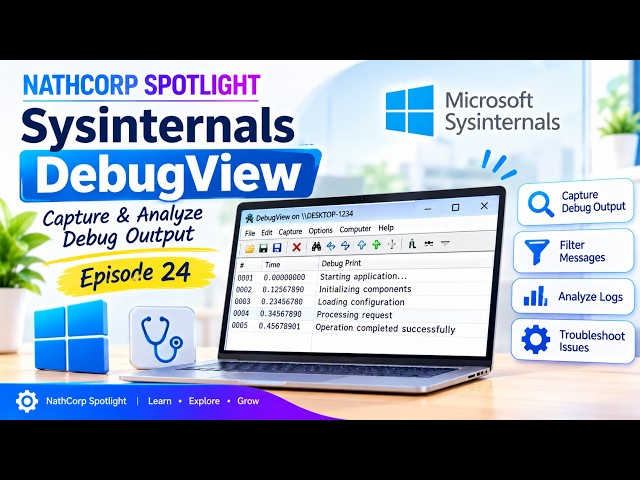
Microsoft Sysinternals DebugView Tutorial | Capture & Analyze Windows Debug Output | Episode 24

Welcome to Episode 24 of NathCorp Spotlight, where we explore powerful Microsoft tools and technologies through simple ...

23:28
Microsoft Sysinternals DebugView Tutorial | Capture & Analyze Windows Debug Output | Episode 24

57 views

7d ago

Flame IDE
Debug & Profile JavaScript/TypeScript in One Click (Zero Config)

Debugging and profiling JS/TS without launch configs or external tools. Learn more: ...

1:22
Debug & Profile JavaScript/TypeScript in One Click (Zero Config)

1 view

1d ago

Dev Aakash Sajjad
Stop Using console.log Like This (5 Better Ways to Debug JavaScript)

Still debugging JavaScript with console.log after console.log? Here are 5 better console methods (plus 2 bonus tricks) that will ...

1:56
Stop Using console.log Like This (5 Better Ways to Debug JavaScript)

2 views

1d ago

Oddly Yogi
Go : Debug and Profile

Where does a Go program spend its time and memory, and how do we prove a fix helps? In this video we profile Shrink's server ...

9:50
Go : Debug and Profile

4 views

5d ago

GetYr_CSE
VS Code Debugger: 3 Tricks to Stop Guessing & Fix Bugs Fast

Are you looking at a screen full of code with no idea what is happening inside? You press run, and the program just breaks.

4:46
VS Code Debugger: 3 Tricks to Stop Guessing & Fix Bugs Fast

6 views

5d ago

MasterTechTopics
Module 26: Debugging React Applications — The Complete Masterclass | Zero to Mastery

A complete, zero-fluff engineering masterclass on Debugging React Applications in React. Curriculum overview and deep-dive ...

12:19
Module 26: Debugging React Applications — The Complete Masterclass | Zero to Mastery

3 views

5d ago

Gotroot Labs
SpyHunt PRO Built-In Browser DevTools: Inspect, Debug and Test Targets Faster

SpyHunt PRO's built-in browser now includes integrated Developer Tools for authorized web security testing and bug bounty ...

1:00
SpyHunt PRO Built-In Browser DevTools: Inspect, Debug and Test Targets Faster

32 views

7d ago

Bonverium Studio
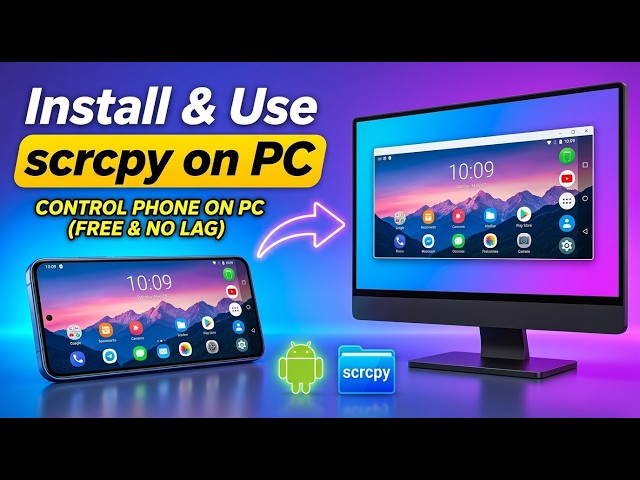
How to Mirror & Control Android on PC (USB CABLE) - Scrcpy Setup Guide with

Want to mirror and control your Android phone directly from your Windows PC? In this tutorial, I'll show you how to use scrcpy, ...

5:39
How to Mirror & Control Android on PC (USB CABLE) - Scrcpy Setup Guide with

2 views

3h ago

Dexter Tutorials
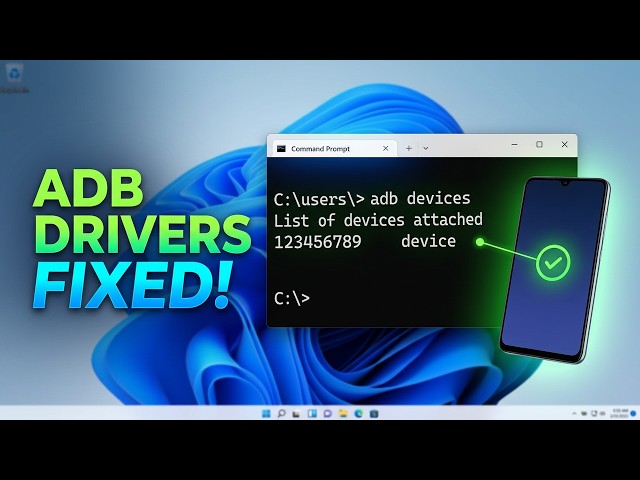
How To Install ADB Drivers on Windows 11 tutorial

Learn how to install ADB drivers on Windows 11 with this step-by-step guide to get your device recognized immediately.

16:12
How To Install ADB Drivers on Windows 11 tutorial

224 views

6d ago

Cipher Bridge
Debug AI Agents with LangGraph Studio: Breakpoints, State Editing and Replay (Module 9)

Debugging Agents With LangGraph Studio: See, step through, edit and replay your graphs visually. Module 9 of 12 in the Cipher ...

6:21
Debug AI Agents with LangGraph Studio: Breakpoints, State Editing and Replay (Module 9)

52 views

7d ago

GDG Krakow
AI, Please Stop Guessing: Chrome DevTools MCP | Dominika Zając | DevFest Kraków 2026

AI is great at generating code, but terrible at understanding what's actually happening inside your browser. We still copy-paste ...

44:32
AI, Please Stop Guessing: Chrome DevTools MCP | Dominika Zając | DevFest Kraków 2026

23 views

6d ago

Kenz Apps
Proxycept: one debugging proxy for every device

The bug is on the lab phone. The proxy is on someone's laptop. Proxycept is a debugging proxy that runs on a server. Point a ...

0:38
Proxycept: one debugging proxy for every device

6 views

4d ago

Torvanis
Debug AI Apps Without Logging Every Prompt - Troubleshooting Capture Demo | JanusEdge

Debug a failing AI app without turning on prompt logging for everyone. In this 2-minute demo, an internal support bot starts failing ...

2:09
Debug AI Apps Without Logging Every Prompt - Troubleshooting Capture Demo | JanusEdge

3 views

5d ago

MergeToMaster
I Tried to Crack the Enigma Code With Just My Laptop

... code or any AI coding tools to see if it was possible to crack enigma with just some regular old fashioned software development.

13:32
I Tried to Crack the Enigma Code With Just My Laptop

589 views

5d ago

Paulinho Fernando
10 AI coding tools that write code while software stays bad

Discover why generative AI coding assistants have completely revolutionized typing speed while leaving fundamental software ...

3:47
10 AI coding tools that write code while software stays bad

21 views

3d ago

ARA Applied
Debugging raspberry pi pico with daplink

Learn how to debug the Raspberry Pi Pico using an open-source DAPLink debugger and VSCode. In this video, we walk through ...

3:09
Debugging raspberry pi pico with daplink

47 views

6d ago

KEYENCE CORPORATION
PLC Software Tutorial - Monitoring & Debugging | KEYENCE KV-X Series

KV STUDIO software provides multiple ways to monitor data within a KEYENCE KV-X Series PLC program, along with debugging ...

11:27
PLC Software Tutorial - Monitoring & Debugging | KEYENCE KV-X Series

121 views

6d ago

Toolsvana
User agent parser: decode UA strings from your server logs

Paste any user agent string and see the browser, operating system, device type and rendering engine it describes. Built for ...

0:17
User agent parser: decode UA strings from your server logs

3 views

4d ago

Software Engineer Mind Maps
The Internal Tool That Earned Him Equity

A 15-minute director meeting that meant additional equity — earned by one internal debug tool. Two years of need-finding, 2.5 ...

2:06
The Internal Tool That Earned Him Equity

1 view

7d ago

First Principles AI
29. Python Testing Explained: pytest, Fixtures, Debugging | Python

Lecture 29 of 34 · Python Without tests every refactor is a gamble, so you stop touching working code and the codebase calcifies.

5:10
29. Python Testing Explained: pytest, Fixtures, Debugging | Python

21 views

1d ago