Upload date
All time
Last hour
Today
This week
This month
This year
Type
All
Video
Channel
Playlist
Movie
Duration
Short (< 4 minutes)
Medium (4-20 minutes)
Long (> 20 minutes)
Sort by
Relevance
Rating
View count
Features
HD
Subtitles/CC
Creative Commons
3D
Live
4K
360°
VR180
HDR
553,663 results
176 views
10mo ago
Debugging is one of the most time-consuming parts of software development—but AI is changing that. In this video, we explore ...
28 views
3mo ago
Debugging in Free Pascal and Lazarus is far more than pressing F9. In this video, we break down the complete debugging ...
672 views
4mo ago
Native Windows debugging - C/C++, services, and even the Windows kernel - right inside VS Code. Same breakpoints, call stack, ...
145 views
5mo ago
... applications so GDB and debugging tools uh presented by Patrick yesterday uh GDB is a part of one API software it's available ...
6mo ago
Welcome to my Channel...! Debugging Tips and Tricks ☕ BuyMeACoffee: https://buymeacoffee.com/missgoogle Host MERN ...
25 views
9mo ago
This webinar gives an overview of how winIDEA & BlueBox products can be used to perform automated tests on real hardware ...
35 views
1mo ago
Learn how to source-level debug Patina, including an overview of the supporting components and available tools, with a ...
106 views
Install PHP and Debug support on Windows manually, and debug PHP projects easily in VS Code with PHP Tools for Visual ...
419 views
How To Enable Debugging on Windows 10 [Guide] In this tutorial, viewers will learn how to enable debugging on their Windows ...
462 views
Debugging is time-consuming—but AI changes the game. See how it improves accuracy, speeds up reviews, and integrates with ...
27 views
7mo ago
Learn the complete concept of Testing and Debugging in Software Engineering in this easy-to-understand video. In this tutorial ...
401 views
Rest API Inspector is a powerful, lightweight Chrome extension built for frontend developers, full-stack engineers, QA testers, and ...
239 views
After performing "micro-surgery" to fix misaligned and broken pins on the FBI chip, I thought the hard part was over. Head over to ...
9,504 views
A few debugging tools in Python.
2 views
What is Debugging? debugging explained debugging in programming debugging tools debugging techniques Topics Covered: ...
201 views
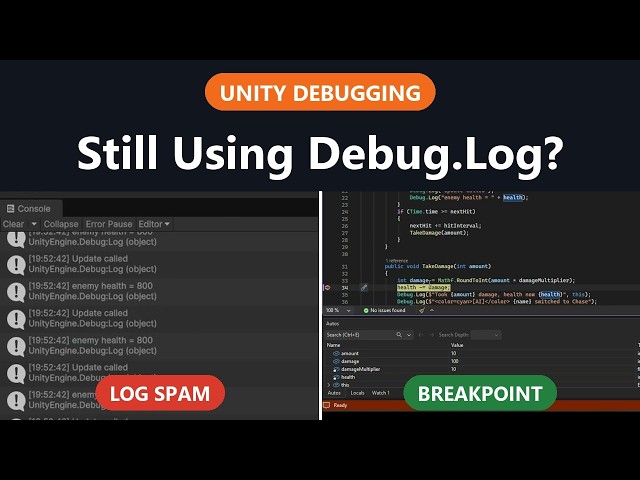
... and the Inspector's Debug mode. Full guide with Rider and VS Code setup, the other built-in debugging tools, debugging builds ...
60 views
4w ago
Debugging and Testing of Programs: Essential Techniques for Developers is designed to equip you with the skills needed to ...
13 views
8mo ago
csconcepts #softwareengineering In this lecture, we explain Software Debugging with a simple and practical example in Urdu ...
500 views
We will also learn important debugging tools such as Continue, Step Over, Step Into, Step Out, Stop, and Restart, along with the ...
202 views
2mo ago