Upload date
All time
Last hour
Today
This week
This month
This year
Type
All
Video
Channel
Playlist
Movie
Duration
Short (< 4 minutes)
Medium (4-20 minutes)
Long (> 20 minutes)
Sort by
Relevance
Rating
View count
Features
HD
Subtitles/CC
Creative Commons
3D
Live
4K
360°
VR180
HDR
131,450 results
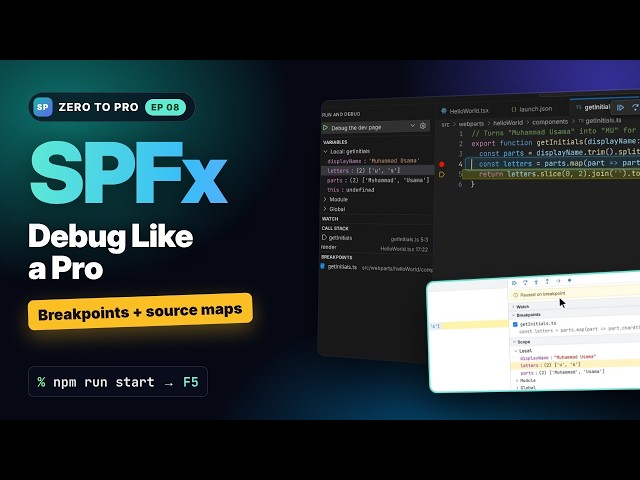
Our web part shows the wrong initials, so we debug it like a pro. In this episode you load local SPFx code on a real SharePoint ...
56 views
3w ago
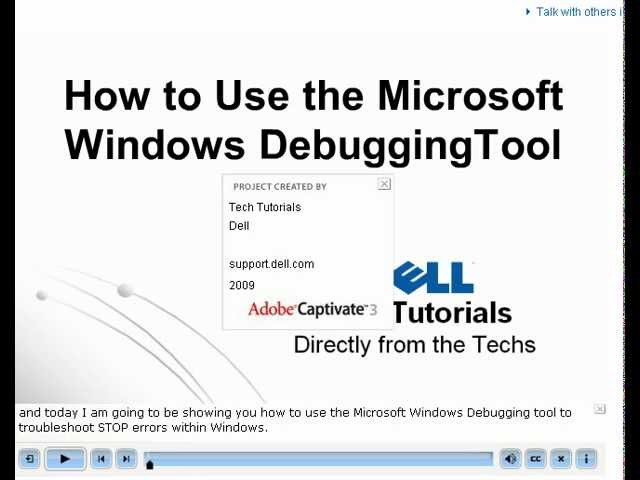
Debugging Tool for Windows is a set of extensible tools for debugging device drivers for the Microsoft Windows family of operating ...
54,923 views
14y ago
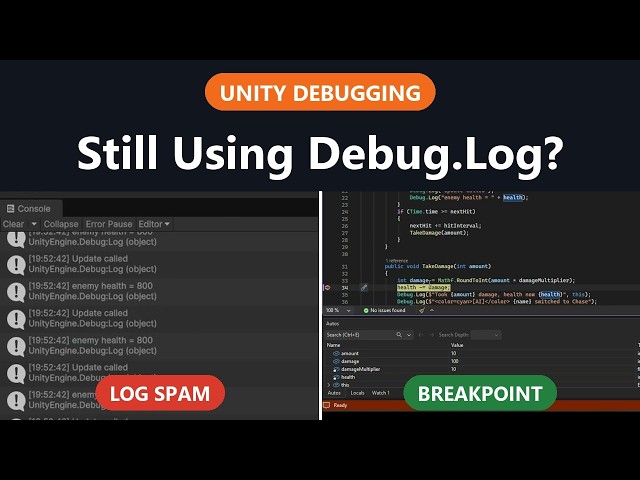
... and the Inspector's Debug mode. Full guide with Rider and VS Code setup, the other built-in debugging tools, debugging builds ...
60 views
4w ago
Unlock the complexities of x64 Windows assembly! This comprehensive tutorial guides you through: • Create a Windows ...
5,056 views
2y ago
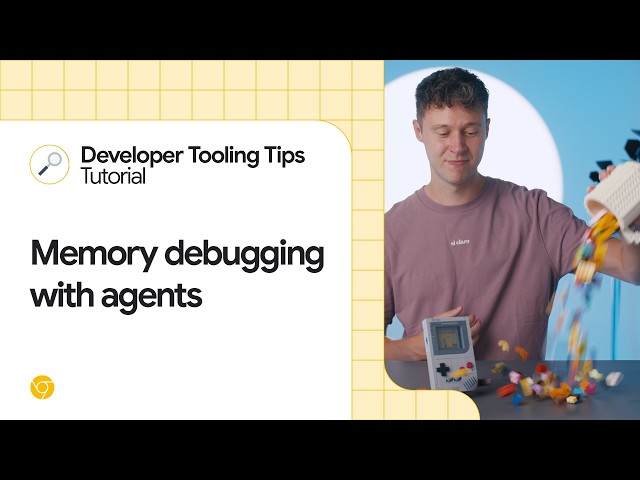
DevTools for agents now provides dedicated memory debugging tools to help identify memory leaks in web applications.
5,764 views
13d ago
Learn how to resolve the 'No disassembly available' error when debugging Windows Script Files (*.WSF) with Visual Studio and ...
7 views
You don't have to build a debugger to learn from one. What can breakpoints, stack unwinding, and stepping through code reveal ...
1,034 views
9d ago
Abroad Education Channel : https://www.youtube.com/channel/UC9sgREj-cfZipx65BLiHGmw contact me on gmail at ...
11,186 views
11mo ago
Symbolic debug info on Unix-like systems is relatively well understood. There's a publicly available specification (DWARF), plenty ...
481 views
2w ago
Are failing integration tests leaving you staring at Program log: traces and unsure where to start? Learn a repeatable workflow to ...
3 views
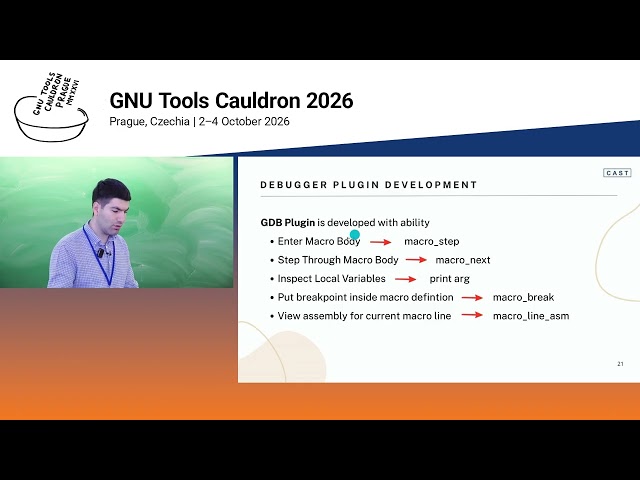
The talk is about debugging C/C++ macros like functions. Currently, GDB treats macro expansions as a single opaque step, ...
189 views