ViewTube

ViewTube
Sign inSign upSubscriptions
Filters

Upload date

Type

Duration

Sort by

Features

Reset

458,471 results

Simon Sez IT
How to Create Data Visualization in Excel using Tables, Slicers and Charts (Includes Free Files)

Download the free course files and follow along here: ...

46:13
How to Create Data Visualization in Excel using Tables, Slicers and Charts (Includes Free Files)

4,493 views

1y ago

MySkill
Short Class Data Visualization with Microsoft Excel | MySkill

Halo Bestie✨ Yuk, simak materi "Data Visualization with Microsoft Excel" dari tutor berpengalaman di Short Class Microsoft Excel ...

1:54:13
Short Class Data Visualization with Microsoft Excel | MySkill

3,429 views

Streamed 1d ago

Kenji Explains
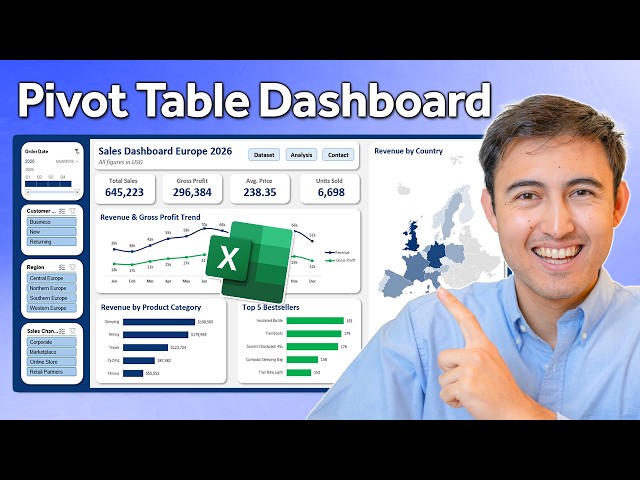
Make an Interactive Excel Dashboard From Scratch (Full Tutorial)

Make an interactive Excel Dashboard using Pivot Tables from scratch. Get 20% OFF our Data Analyst Program: ...

29:35
Make an Interactive Excel Dashboard From Scratch (Full Tutorial)

177,361 views

2mo ago

Marg Analytics
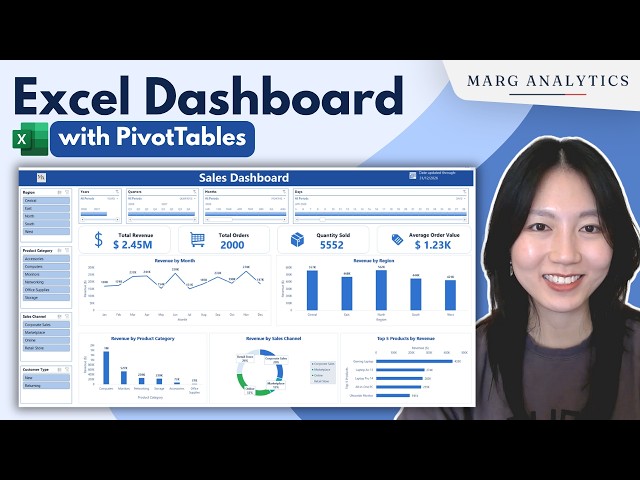
Build an Interactive Excel Dashboard Using PivotTables

In this video, I'll show you how to build an interactive Excel sales dashboard using PivotTables, PivotCharts, slicers, and timelines.

50:35
Build an Interactive Excel Dashboard Using PivotTables

269,792 views

3mo ago

DataCamp
AI-Powered Data Analysis with Excel & Claude

Session Resources: https://bit.ly/4zpZP4D Register for this session: ...

1:04:45
AI-Powered Data Analysis with Excel & Claude

3,141 views

Streamed 4h ago

Vizspire
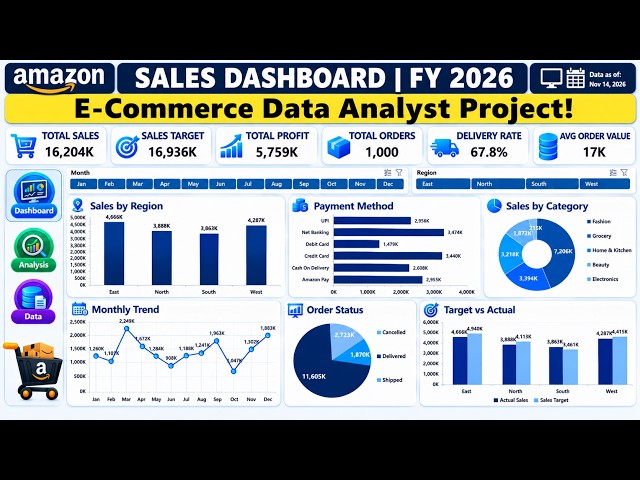
COMPLETE E-Commerce Data Analytics Project | Excel Dashboard | End-to-End Analyst Portfolio Project

JOIN OUR COMMUNITY & STAY UPDATED: WhatsApp Channel: https://whatsapp.com/channel/0029Vb8mtfx7IUYZIFVAqU1Y ...

22:33
COMPLETE E-Commerce Data Analytics Project | Excel Dashboard | End-to-End Analyst Portfolio Project

999 views

4d ago

LearnAIR™
Copilot Skills: Make Excel & PowerPoint More Powerful

Are you getting the most out of Microsoft 365 Copilot? If you're still manually cleaning Excel data, choosing charts, or reformatting ...

30:25
Copilot Skills: Make Excel & PowerPoint More Powerful

4,976 views

11d ago

Meritt Learning Center
🎯 Data visualization-In Microsoft Excel and Power (Part A)

Contact Meritt Learning Center, training@merittconsultants.com; Contact: +91-7428466822; www.merittconsultants.com Session ...

2:32:43
🎯 Data visualization-In Microsoft Excel and Power (Part A)

534 views

1mo ago

The Leadership Labs Initiative
Excel for Data Analysis & Visualization | Complete Hands-On Training

A complete hands-on Excel training covering data cleaning, modern formulas, PivotTables, data visualization, and interactive ...

2:07:47
Excel for Data Analysis & Visualization | Complete Hands-On Training

75 views

1mo ago

StraightOuttaKapston
Turn Excel into an Interactive HTML Dashboard with ChatGPT (Prompts Included)

Turn Excel data into a fully interactive HTML dashboard with ChatGPT — no coding experience needed. In this video, I use a ...

2:56
Turn Excel into an Interactive HTML Dashboard with ChatGPT (Prompts Included)

1,569 views

2w ago

Maven Analytics
9 Essential Chart Types for Data Analysts | Data Visualization 101

Early Black Friday Savings! Save $160 on a full year of Maven Pro https://bit.ly/4C13VCQ There are so many chart types to ...

7:14
9 Essential Chart Types for Data Analysts | Data Visualization 101

9,085 views

10mo ago

Dr. Rakesh Maurya
Data Visualization in Excel

Numbers alone do not always tell the full story. Data visualization helps researchers transform numerical data into clear, ...

40:37
Data Visualization in Excel

51 views

3mo ago

Simplilearn
AI-Powered Business Analytics Full Course 2027 | Learn Excel, Data Analysis & AI Tools | Simplilearn

" Microsoft Azure - AI-Powered Business Analyst ...

9:31:36
AI-Powered Business Analytics Full Course 2027 | Learn Excel, Data Analysis & AI Tools | Simplilearn

5,806 views

9d ago

EXCEL FOR FINANCE AND BUSINESS NICHOLAS.
Advanced Excel Data Visualization: How To Create Tables+Pivot tables+Pivot charts+Slicers

Adanced data analysis/visualization with excel. #excel #exceltips #pivot_table.

1:00:01
Advanced Excel Data Visualization: How To Create Tables+Pivot tables+Pivot charts+Slicers

135 views

7mo ago

MySkill
Short Class Data Visualization with Microsoft Excel | MySkill

Hello Bestie🙌 ✍️ Be more productive while waiting for iftar (breaking time) by learning Data Visualization with Microsoft ...

1:51:20
Short Class Data Visualization with Microsoft Excel | MySkill

3,194 views

Streamed 8mo ago

Meritt Learning Center
🎯 Data visualization-In Microsoft Excel and Power (Part 2)

Contact Meritt Learning Center, training@merittconsultants.com; Contact: +91-7428466822; www.merittconsultants.com Session ...

2:27:02
🎯 Data visualization-In Microsoft Excel and Power (Part 2)

158 views

1mo ago

MySkill
Short Class Data Visualization with Microsoft Excel | MySkill

Hello Bestie👋 Invest your time in learning Microsoft Excel with experienced tutors in MySkill's Microsoft Excel Short Class ...

1:55:27
Short Class Data Visualization with Microsoft Excel | MySkill

7,627 views

Streamed 4mo ago

Karina Adcock
Data visualization in excel charts: alternatives to legends

Direct labels, color-coded titles: Overlap the legend and the chart Move the legend to the top Change the color of the text in the ...

5:11
Data visualization in excel charts: alternatives to legends

248 views

6mo ago

Mwosh Tech Solutions Services
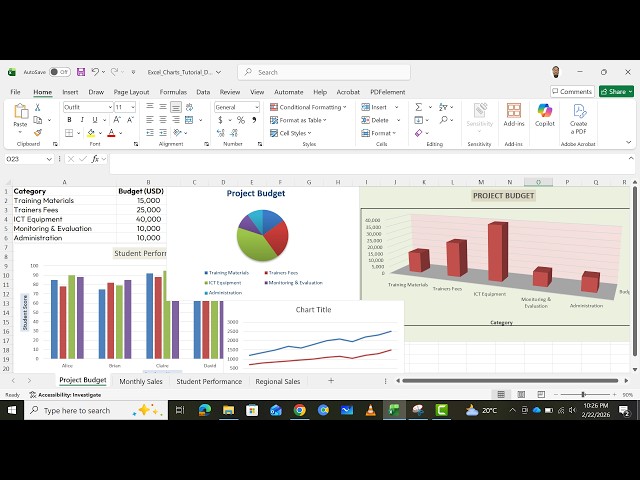
Excel Charts & Dashboards Tutorial | Data Visualization for Beginners 2026

Want to turn raw data into clear, powerful visuals? In this beginner-friendly Excel tutorial, you'll learn how to create charts, graphs, ...

1:47:50
Excel Charts & Dashboards Tutorial | Data Visualization for Beginners 2026

58 views

9mo ago

Etienne Insights
Understanding Charts in Excel | Data Visualization for Beginners

Turn your Excel data into clear, attractive, and professional charts. In this practical tutorial, you will learn how to create ...

34:12
Understanding Charts in Excel | Data Visualization for Beginners

486 views

8mo ago