Upload date
All time
Last hour
Today
This week
This month
This year
Type
All
Video
Channel
Playlist
Movie
Duration
Short (< 4 minutes)
Medium (4-20 minutes)
Long (> 20 minutes)
Sort by
Relevance
Rating
View count
Features
HD
Subtitles/CC
Creative Commons
3D
Live
4K
360°
VR180
HDR
4,603,976 results
This comprehensive tutorial will teach you everything you need to know about Excel chart types, chart customization, and creating ...
129,537 views
2y ago
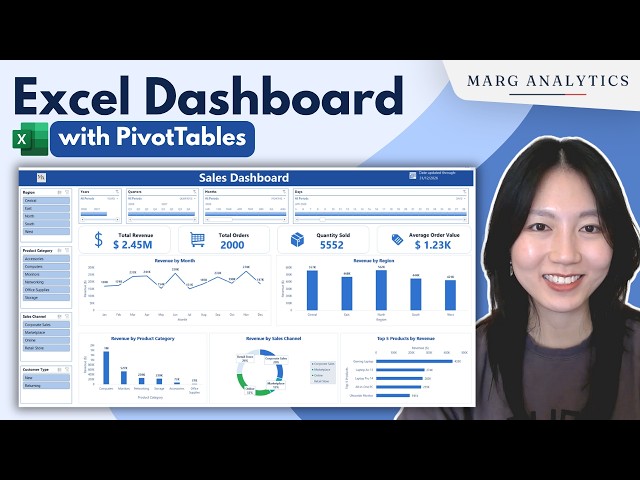
In this video, I'll show you how to build an interactive Excel sales dashboard using PivotTables, PivotCharts, slicers, and timelines.
269,778 views
3mo ago
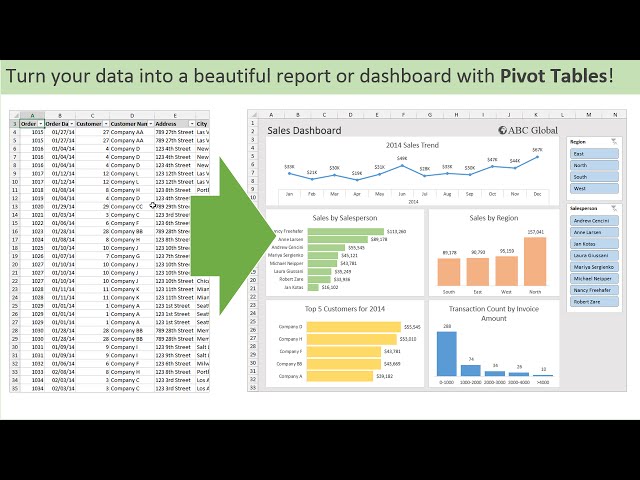
Sign up for our Excel webinar, times added weekly: https://www.excelcampus.com/blueprint-registration/ PART 1: ...
15,535,916 views
11y ago
In this video, you'll learn how to visualize data totals, trends, geographical data, and more with Excel's TOP 5 data visualization ...
7,483 views
3y ago
Learn Excel in just 2 hours: https://kevinstratvert.thinkific.com In this step-by-step tutorial, learn how to pull together charts in Excel.
1,544,683 views
OFF My Dashboards Course (code: SAVE50) https://chandoo.org/wp/excel-school-program/ ~ Become an Excel Dashboard ...
286,147 views
1y ago
Data Visualization Monthly Budget Tracker https://shorturl.at/fhlwz.
65,337 views
4y ago
" Microsoft Azure - Data Analyst Course ...
15,689 views
Download the free course files and follow along here: ➡️https://www.simonsezit.com/charts-and-dashboards-in-excel-demo-files ...
15,573 views
Learn Data Analysis Essentials in Excel in Just 12 minutes! Take our Data Analyst Program here: ...
246,548 views
Download the free course files and follow along here: ...
4,493 views
AD: Sign up to enroll for a 7-day free trial with Coursera now!
3,490,715 views
In this step-by-step tutorial, learn how to create dynamic and interactive Excel dashboards. With a dashboard, you can showcase ...
3,951,546 views
5y ago
... DOWNLOAD Free Excel file for this video: https://view.flodesk.com/pages/63dd44d5781752946ff2af78 In this video we'll build a ...
1,912,780 views
Make an interactive Excel Dashboard using Pivot Tables from scratch. Get 20% OFF our Data Analyst Program: ...
177,335 views
2mo ago
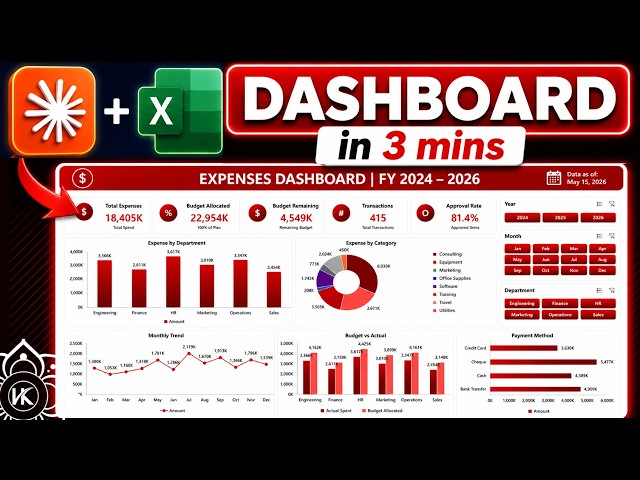
... #aitools2026 #aitools2026 #nocodingjobs #datavisualization #claudeaitutorial #1 #claudecowork #claude #claudecode ...
538,067 views
5mo ago
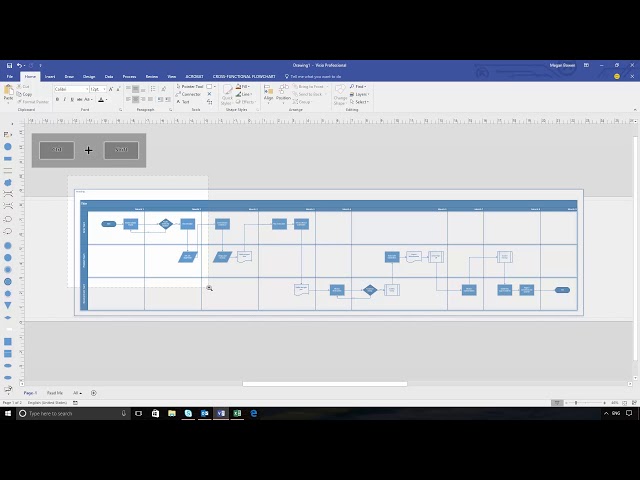
Learn how a process analyst can import data from Excel directly into Visio to generate process diagrams easily. Process steps are ...
371,317 views
9y ago
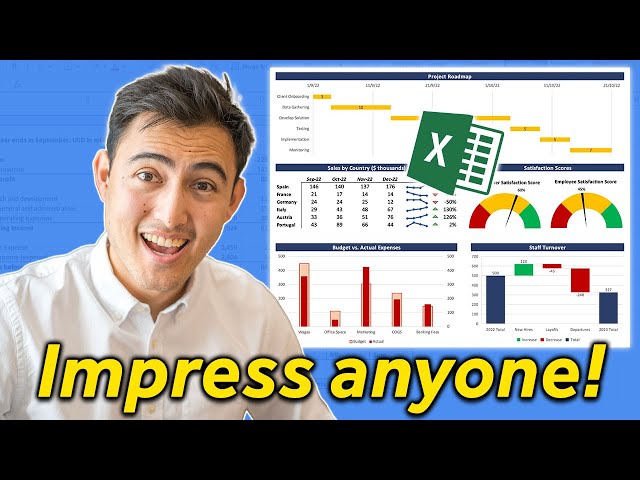
Get our Excel Course here: https://www.careerprinciples.com/courses/excel-for-business-finance DOWNLOAD Free Excel file ...
540,157 views
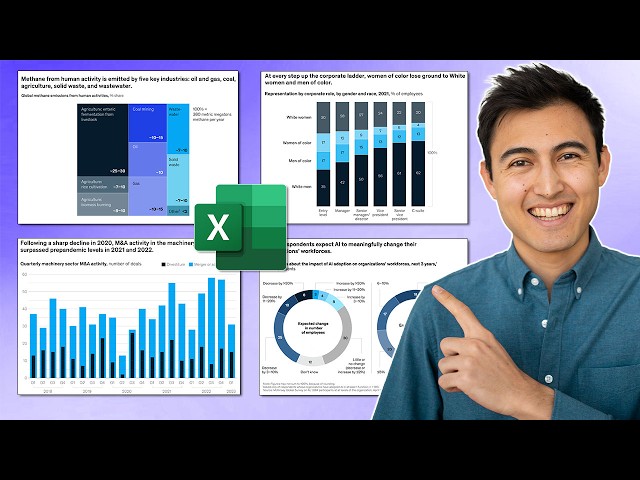
... Free Excel file for this video: https://careerprinciples.myflodesk.com/mssfixa655 In this video, I make 3 McKinsey visuals in Excel ...
480,715 views
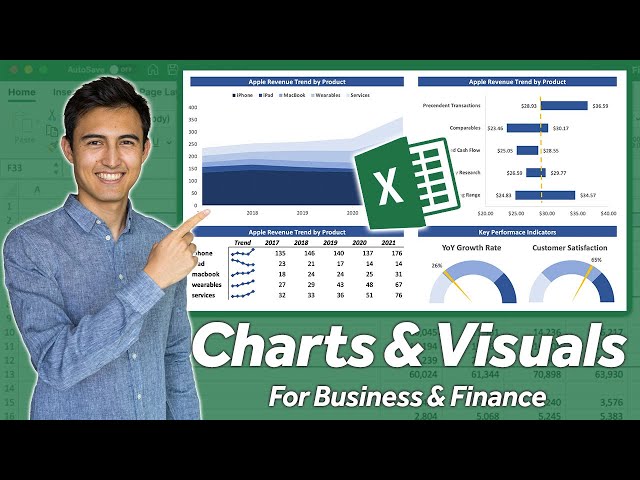
The best Excel Charts for data visualization, specifically for business & finance professionals. Firstly, we go over a stacked area ...
219,430 views