ViewTube

ViewTube
Sign inSign upSubscriptions
Filters

Upload date

Type

Duration

Sort by

Features

Reset

140 results

DataCamp
AI-Powered Data Analysis with Excel & Claude

Session Resources: https://bit.ly/4zpZP4D Register for this session: ...

1:04:45
AI-Powered Data Analysis with Excel & Claude

3,105 views

Streamed 4h ago

Excel Visual
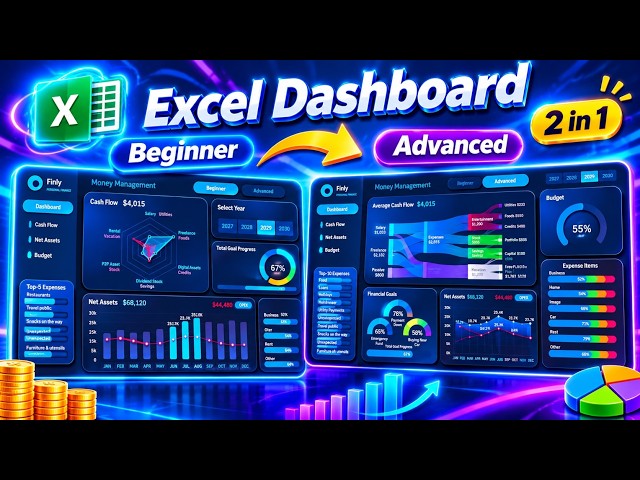
How to Build an Excel Dashboard for Managing Personal Finances Beginner to Advanced

... for Managing Personal Finances Stress-Free • Go from Beginner to Advanced in Excel data visualization • See the real process ...

3:07:43
How to Build an Excel Dashboard for Managing Personal Finances Beginner to Advanced

650 views

1d ago

MySkill
Short Class Data Visualization with Microsoft Excel | MySkill

Halo Bestie✨ Yuk, simak materi "Data Visualization with Microsoft Excel" dari tutor berpengalaman di Short Class Microsoft Excel ...

1:54:13
Short Class Data Visualization with Microsoft Excel | MySkill

3,429 views

Streamed 1d ago

Mathew K Analytics
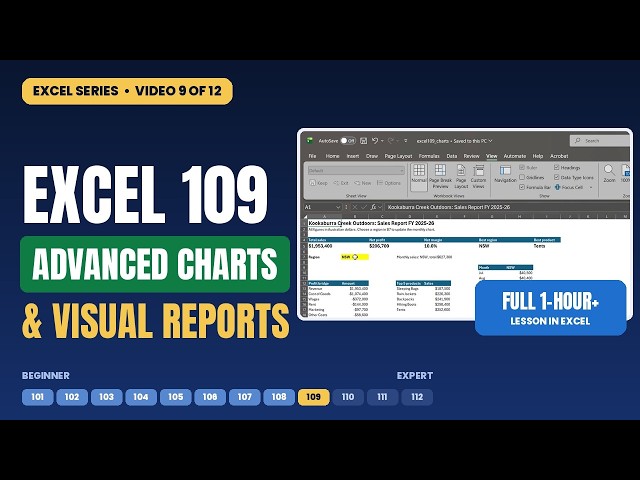
Advanced Excel Charts Full Course: Waterfall, Funnel, Dynamic Charts & Reports | Excel 109

Go beyond the default chart. Learn what makes a chart clear, then build the modern chart types and a one-page visual report.

1:05:02
Advanced Excel Charts Full Course: Waterfall, Funnel, Dynamic Charts & Reports | Excel 109

6 views

12h ago

Office Monk
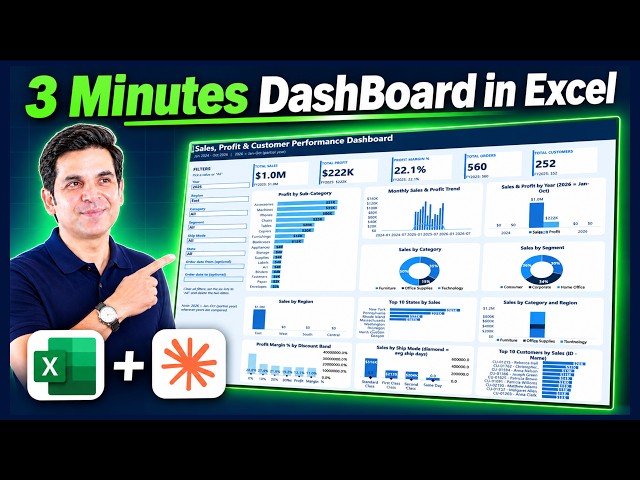
3 Minutes Dashboard in Excel with Claude AI No Prompt Needed!

Download the practice file / dashboard: https://tinyurl.com/mvh4ssn6 (Excel Data) https://tinyurl.com/3xc674dc (Prompt) ...

4:49
3 Minutes Dashboard in Excel with Claude AI No Prompt Needed!

89 views

9h ago

Simplilearn
Data Analyst Full Course 2027 in 24 Hours | Learn Data Analytics Full Course 2026  Simplilearn

... Skills Covered ✓ Data Analytics ✓ Statistical Analysis using Excel ✓ Data Analysis using Python and R ✓ Data Visualization ...

23:25:31
Data Analyst Full Course 2027 in 24 Hours | Learn Data Analytics Full Course 2026 Simplilearn

4,418 views

6h ago

Discover Talent™
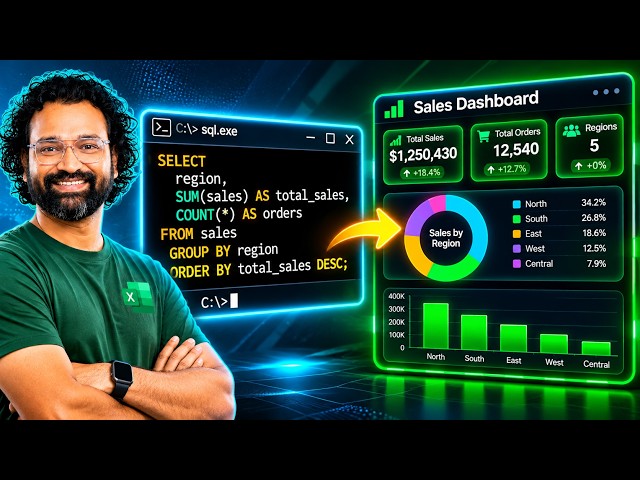
SQL to Excel Dashboard: End-to-End Sales Data Analysis Tutorial

SQL to Excel Dashboard: End-to-End Sales Data Analysis Tutorial Master SQL and Excel for real-world business analytics!

50:51
SQL to Excel Dashboard: End-to-End Sales Data Analysis Tutorial

27 views

6h ago

InfoZoom
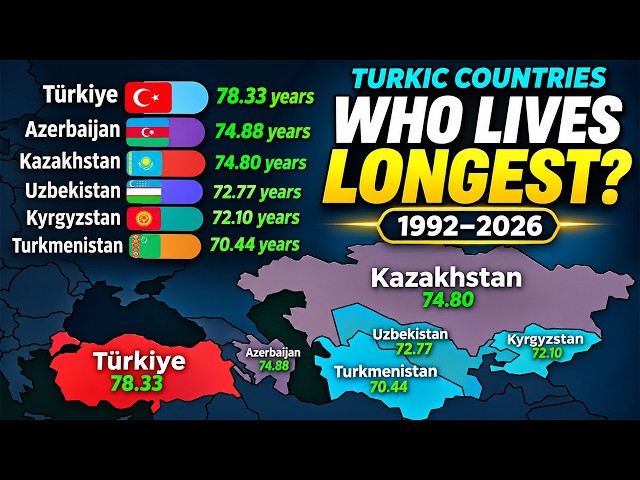
Which Turkic Country Lives the Longest? | 1992–2026

... both sexes combined #LifeExpectancy #TurkicCountries #Longevity #BarChartRace #DataVisualization #CountryComparison ...

8:06
Which Turkic Country Lives the Longest? | 1992–2026

1,120 views

5h ago

Master of Mylab
Excel Chapter 3 Simulation Training | Excel Simulation Training |excel chapter 3 simulation training

... #Spreadsheet #DataAnalysis #BusinessIntelligence #Productivity #TechSkills #ExcelSkills #DataVisualization #ExcelFormulas ...

14:55
Excel Chapter 3 Simulation Training | Excel Simulation Training |excel chapter 3 simulation training

6 views

9h ago

Master of Mylab
Excel Chapter 1: Simulation Training | Excel Chapter 1 Simulation Training | #simulation training

... #Spreadsheet #DataAnalysis #BusinessIntelligence #Productivity #TechSkills #ExcelSkills #DataVisualization #ExcelFormulas ...

23:36
Excel Chapter 1: Simulation Training | Excel Chapter 1 Simulation Training | #simulation training

1 view

8h ago

ThinkData Solutions, Inc
Power BI for Beginners: Build Your First Visualizations | Part 2

Not sure which visualization to use in Power BI? You're not alone! In this lesson, Robin Hunt demonstrates how to start with the ...

9:29
Power BI for Beginners: Build Your First Visualizations | Part 2

0 views

4h ago

IT TECH
MIS Reporting & Interactive Dashboard Using Excel Pivot Tables

Sales MIS Report & Interactive Dashboard in Excel | Excel Pivot Table Project | Sales Data Analysis In this video, I have created a ...

37:50
MIS Reporting & Interactive Dashboard Using Excel Pivot Tables

8 views

8h ago