Upload date
All time
Last hour
Today
This week
This month
This year
Type
All
Video
Channel
Playlist
Movie
Duration
Short (< 4 minutes)
Medium (4-20 minutes)
Long (> 20 minutes)
Sort by
Relevance
Rating
View count
Features
HD
Subtitles/CC
Creative Commons
3D
Live
4K
360°
VR180
HDR
458,453 results
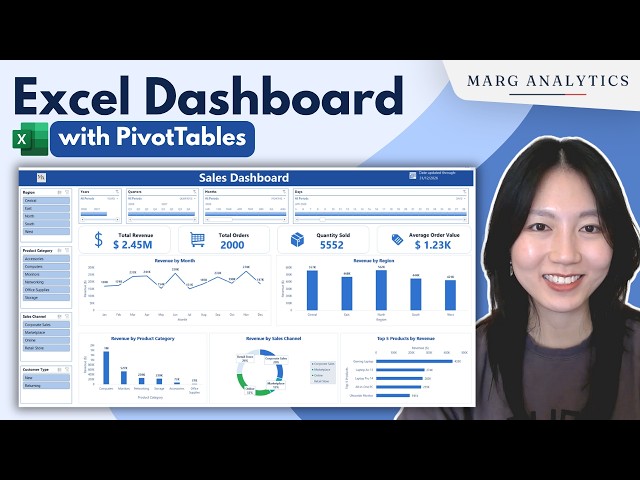
In this video, I'll show you how to build an interactive Excel sales dashboard using PivotTables, PivotCharts, slicers, and timelines.
269,861 views
3mo ago
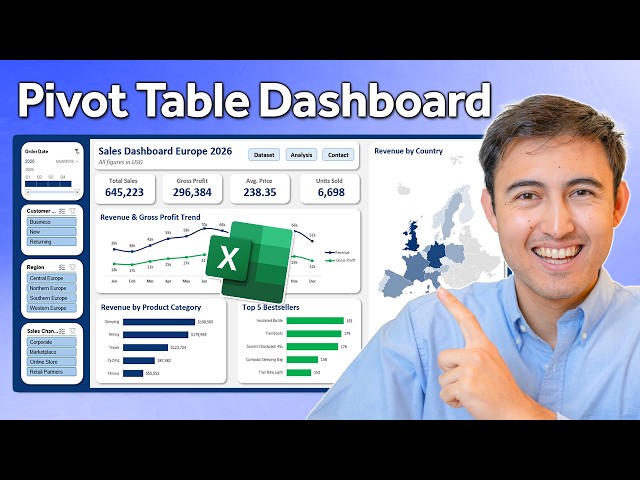
Make an interactive Excel Dashboard using Pivot Tables from scratch. Get 20% OFF our Data Analyst Program: ...
177,603 views
2mo ago
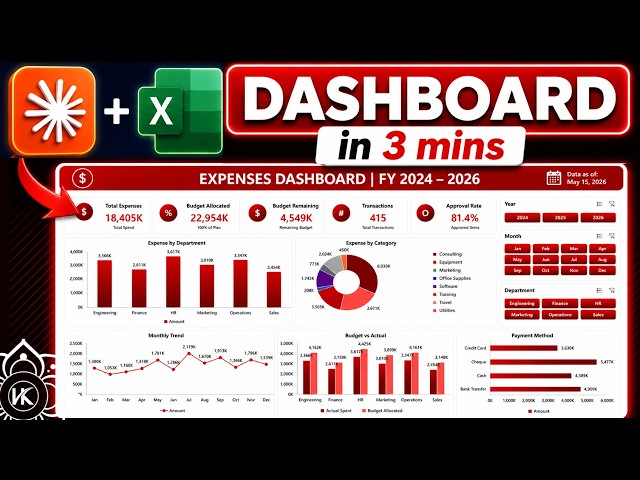
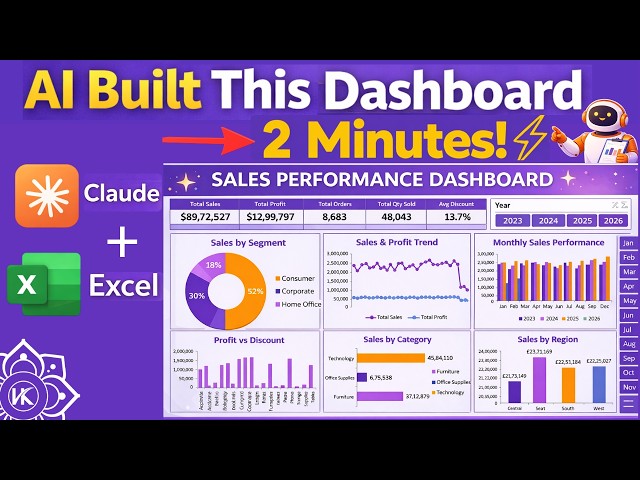
... #aitools2026 #aitools2026 #nocodingjobs #datavisualization #claudeaitutorial #1 #claudecowork #claude #claudecode ...
538,156 views
5mo ago
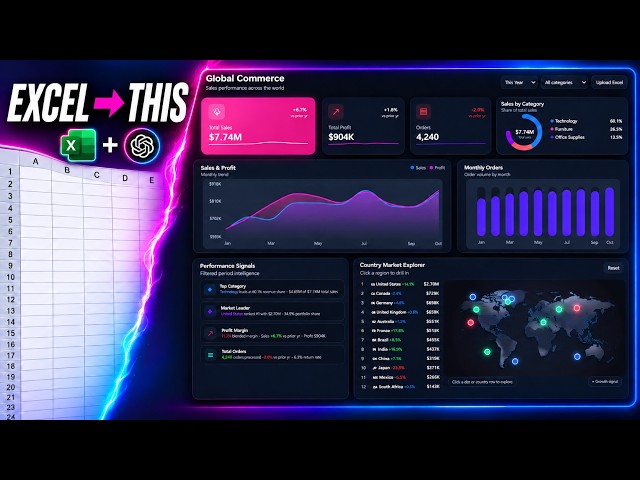
Turn Excel data into a fully interactive HTML dashboard with ChatGPT — no coding experience needed. In this video, I use a ...
1,580 views
2w ago
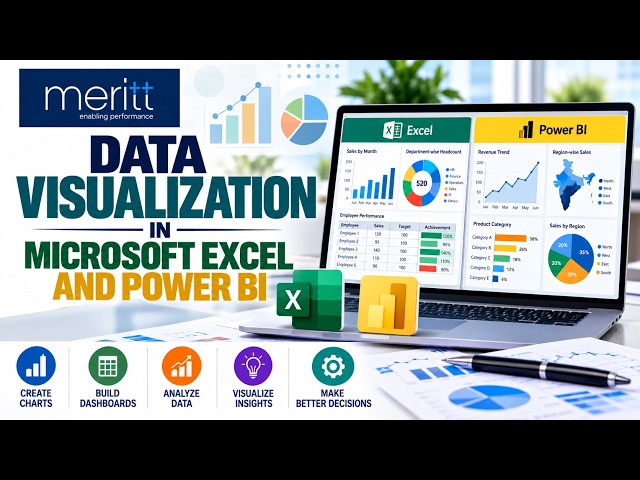
Contact Meritt Learning Center, training@merittconsultants.com; Contact: +91-7428466822; www.merittconsultants.com Session ...
534 views
1mo ago
Free Dashboard : https://vedakarna.com/templates ✓Get your Free VBA Code + Prompts Here: ...
329,761 views
6mo ago
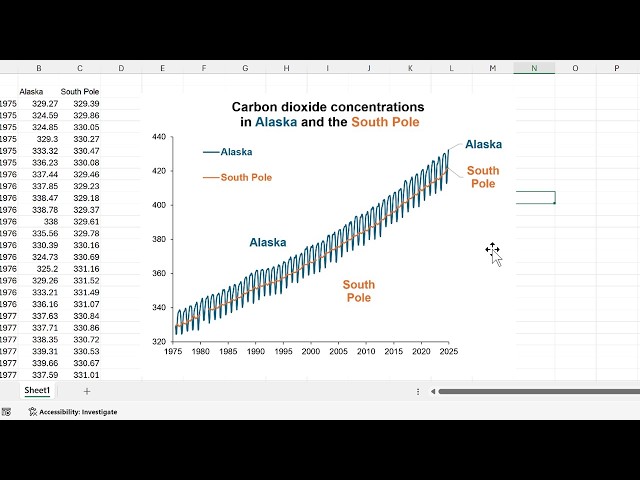
Direct labels, color-coded titles: Overlap the legend and the chart Move the legend to the top Change the color of the text in the ...
248 views
Session Resources: https://bit.ly/4zpZP4D Register for this session: ...
3,443 views
Streamed 7h ago
Hello Bestie🙌 ✍️ Be more productive while waiting for iftar (breaking time) by learning Data Visualization with Microsoft ...
3,194 views
Streamed 8mo ago
Halo Bestie✨ Yuk, simak materi "Data Visualization with Microsoft Excel" dari tutor berpengalaman di Short Class Microsoft Excel ...
3,492 views
Streamed 1d ago
Check out all my Full Courses on Analyst Builder: https://www.analystbuilder.com/ 25% Off Analyst Builder Code: BOOTCAMP In ...
1,211,285 views
Build practical data analysis and visualization skills with the Data Analysis and Visualization with Excel course from uCertify.
55 views