ViewTube

ViewTube
Sign inSign upSubscriptions
Filters

Upload date

Type

Duration

Sort by

Features

Reset

723 results

Excel Visual
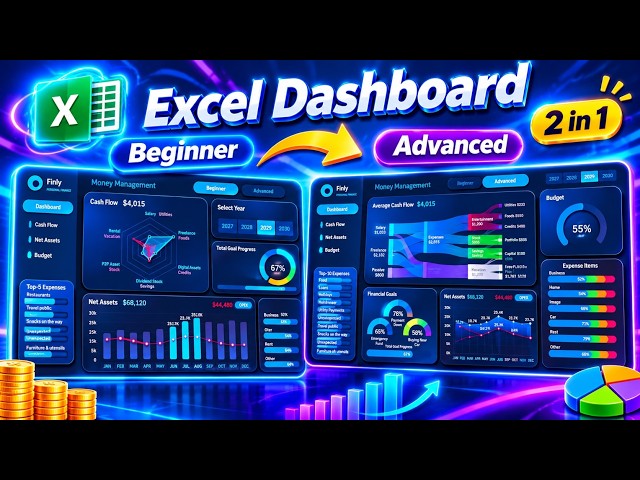
How to Build an Excel Dashboard for Managing Personal Finances Beginner to Advanced

... for Managing Personal Finances Stress-Free • Go from Beginner to Advanced in Excel data visualization • See the real process ...

3:07:43
How to Build an Excel Dashboard for Managing Personal Finances Beginner to Advanced

732 views

1d ago

Vedakarna
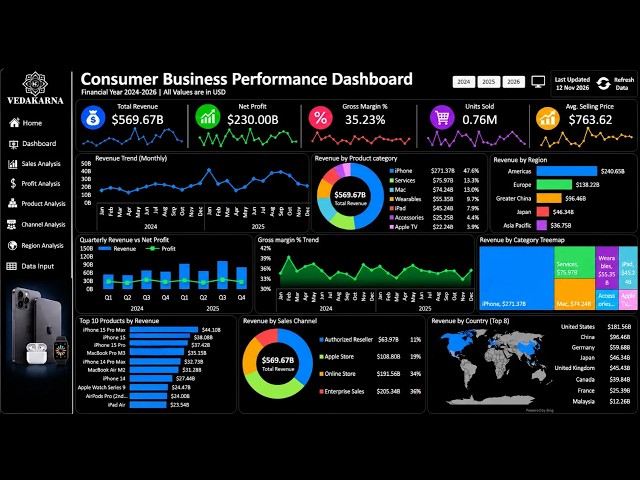
Create a Interactive Consumer Performance Dashboard in Excel | Beginner to Pro

Free Dashboard: https://vedakarna.com/templates WhatsApp: https://whatsapp.com/channel/0029VbCIu9XHVvTSpnBDWr0e ...

21:52
Create a Interactive Consumer Performance Dashboard in Excel | Beginner to Pro

4,175 views

5d ago

DataCamp
AI-Powered Data Analysis with Excel & Claude

Session Resources: https://bit.ly/4zpZP4D Register for this session: ...

1:04:45
AI-Powered Data Analysis with Excel & Claude

3,443 views

Streamed 7h ago

MySkill
Short Class Data Visualization with Microsoft Excel | MySkill

Halo Bestie✨ Yuk, simak materi "Data Visualization with Microsoft Excel" dari tutor berpengalaman di Short Class Microsoft Excel ...

1:54:13
Short Class Data Visualization with Microsoft Excel | MySkill

3,492 views

Streamed 1d ago

Centre of Best Learnings (CBL)
Create an interactive excel dashboard to track and visualise progress dynamically | full tutorial

Create an interactive excel dashboard to track and visualise progress dynamically (full tutorial) #exceldashboard ...

11:28
Create an interactive excel dashboard to track and visualise progress dynamically | full tutorial

105 views

4d ago

Top Courses
Build an AI Data Analysis & Cleaning Agent in Excel with Copilot

Learn how to automate data analysis and simplify data management in Excel using Microsoft 365 Copilot. In this comprehensive ...

38:36
Build an AI Data Analysis & Cleaning Agent in Excel with Copilot

35 views

5d ago

ALOR PATH
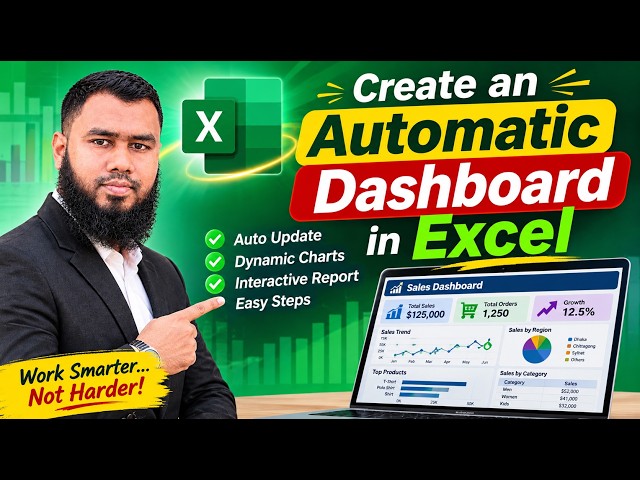
How to Create an Automatic Dashboard in Excel | Interactive Excel Dashboard Tutorial (Step by Step)

... in Excel, Interactive Excel Dashboard, Dynamic Dashboard Excel, Excel Data Visualization, Excel Automation, Advanced Excel ...

2:37
How to Create an Automatic Dashboard in Excel | Interactive Excel Dashboard Tutorial (Step by Step)

51 views

6d ago

My Online Master
Interactive Dashboard in Excel for Data Analytics | Complete Tutorial

Learn how to create an interactive dashboard in Microsoft Excel using Charts and Slicers with this practical tutorial from our Data ...

29:26
Interactive Dashboard in Excel for Data Analytics | Complete Tutorial

69 views

2d ago

Mathew K Analytics
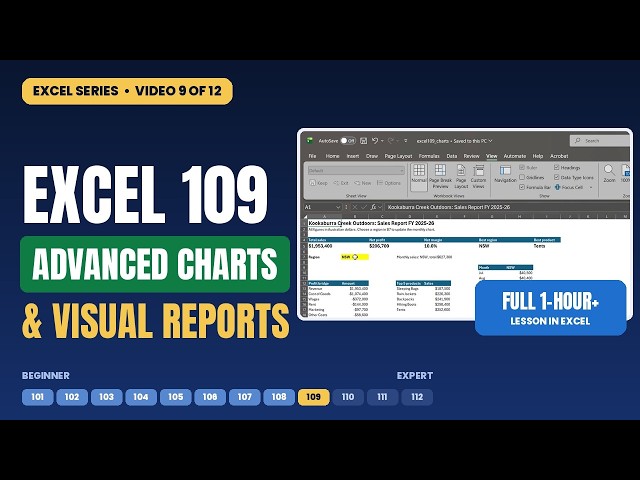
Advanced Excel Charts Full Course: Waterfall, Funnel, Dynamic Charts & Reports | Excel 109

Go beyond the default chart. Learn what makes a chart clear, then build the modern chart types and a one-page visual report.

1:05:02
Advanced Excel Charts Full Course: Waterfall, Funnel, Dynamic Charts & Reports | Excel 109

6 views

16h ago

Simplilearn
Data Analyst Full Course 2027 in 24 Hours | Learn Data Analytics Full Course 2026  Simplilearn

... Skills Covered ✓ Data Analytics ✓ Statistical Analysis using Excel ✓ Data Analysis using Python and R ✓ Data Visualization ...

23:25:31
Data Analyst Full Course 2027 in 24 Hours | Learn Data Analytics Full Course 2026 Simplilearn

4,988 views

10h ago

Frozzenrainbow
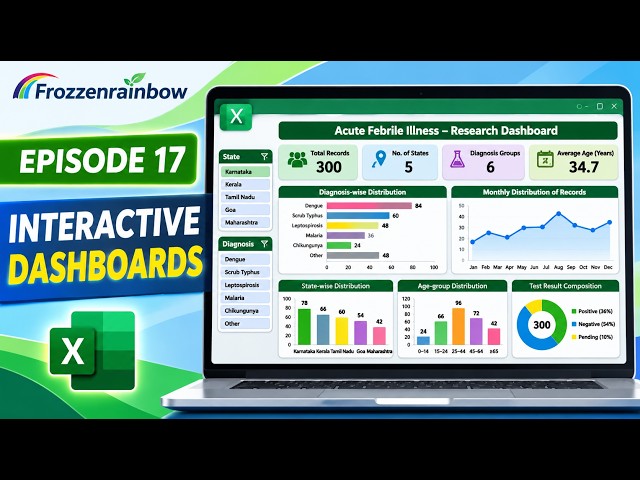
Create an Interactive Dashboard in Excel | Laboratory & Research Data Analysis | Episode 17

Create an Interactive Laboratory Dashboard in Microsoft Excel 365! Welcome to Episode 17 of the Frozzenrainbow Advanced ...

6:33
Create an Interactive Dashboard in Excel | Laboratory & Research Data Analysis | Episode 17

21 views

4d ago

Vizspire
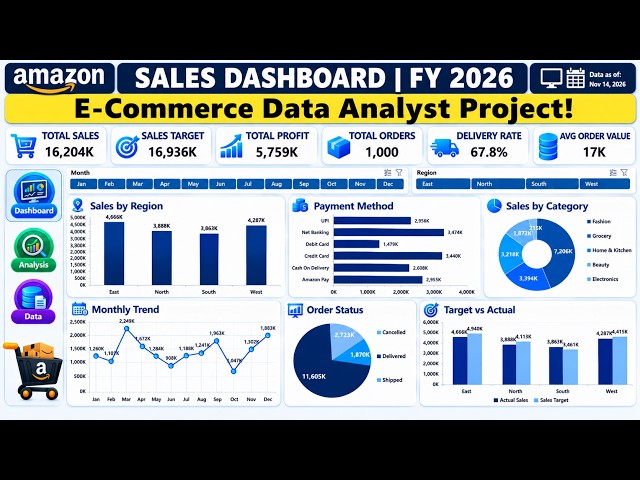
COMPLETE E-Commerce Data Analytics Project | Excel Dashboard | End-to-End Analyst Portfolio Project

JOIN OUR COMMUNITY & STAY UPDATED: WhatsApp Channel: https://whatsapp.com/channel/0029Vb8mtfx7IUYZIFVAqU1Y ...

22:33
COMPLETE E-Commerce Data Analytics Project | Excel Dashboard | End-to-End Analyst Portfolio Project

1,007 views

4d ago

Discover Talent™
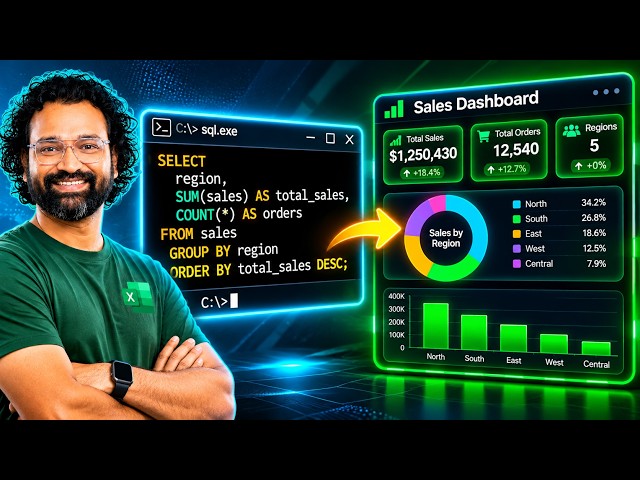
SQL to Excel Dashboard: End-to-End Sales Data Analysis Tutorial

SQL to Excel Dashboard: End-to-End Sales Data Analysis Tutorial Master SQL and Excel for real-world business analytics!

50:51
SQL to Excel Dashboard: End-to-End Sales Data Analysis Tutorial

36 views

9h ago

bi-champ
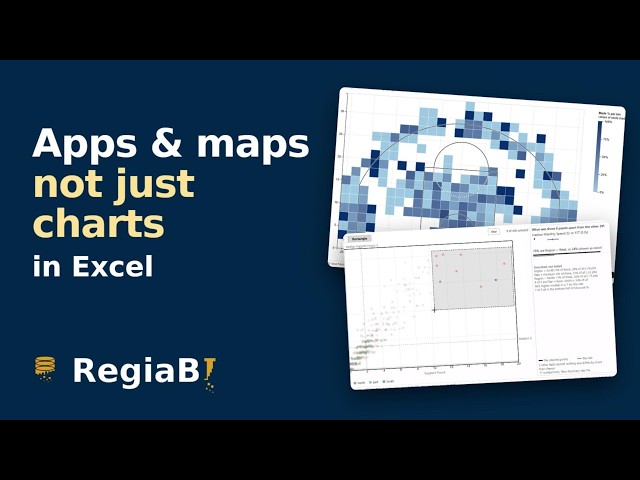
What if AI built Excel apps and maps, not just charts?

Turn an Excel table into apps and maps, not just charts, and change them in plain English. Full walkthrough, the three datasets to ...

6:57
What if AI built Excel apps and maps, not just charts?

3,984 views

3d ago

Blujay Technologies
EXCEL | PART-11 | Data Visualization in Excel | Charts & Advanced Charting Techniques

Welcome to Blujay Technologies! Want to transform raw data into meaningful visual insights? In this session, learn how to use ...

43:29
EXCEL | PART-11 | Data Visualization in Excel | Charts & Advanced Charting Techniques

12 views

2d ago

Simplilearn
AI-Powered Business Analytics Full Course 2027 | Learn Excel, Data Analysis & AI Tools | Simplilearn

" Microsoft Azure - AI-Powered Business Analyst ...

5:58:11
AI-Powered Business Analytics Full Course 2027 | Learn Excel, Data Analysis & AI Tools | Simplilearn

11,925 views

Streamed 6d ago

Data Tutorials
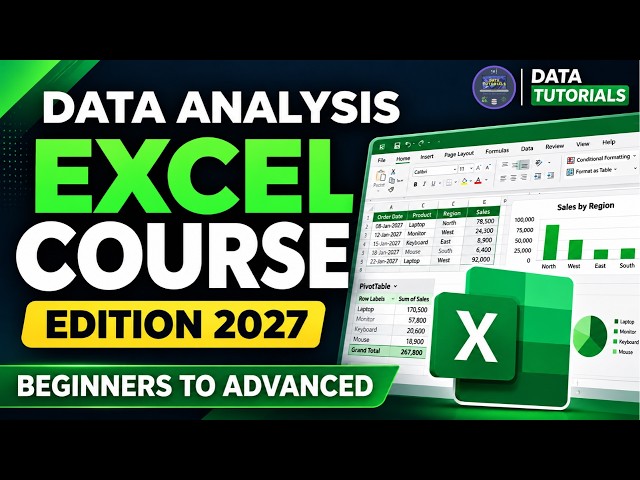
Excel Full Course 2027 | Beginner to Advanced | Complete Excel Tutorial for Data Analysis #excel

excel #dataanalytics #exceltutorial PACKAGED COURSES ✓ Power BI + SQL + Python + Fabric + Projects Course ...

9:46:36
Excel Full Course 2027 | Beginner to Advanced | Complete Excel Tutorial for Data Analysis #excel

8,907 views

2d ago

ScreenVerse Media
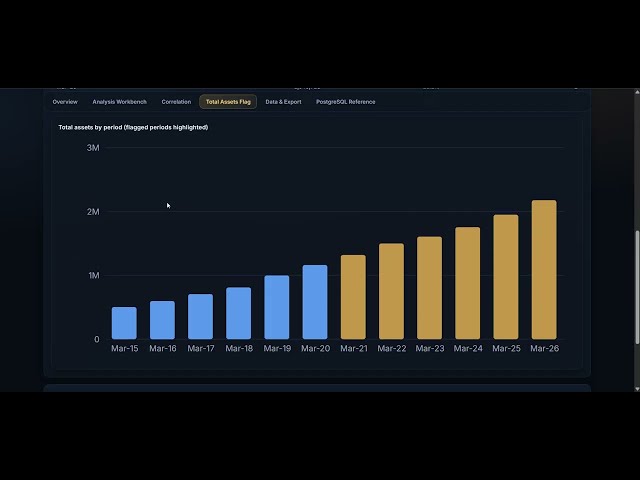
Financial Intelligence Dashboard | Interactive Financial Analysis Using Python & Data Visualization

Financial Intelligence Dashboard | Interactive Financial Analysis Using Python & Data Visualization Financial Intelligence ...

1:01
Financial Intelligence Dashboard | Interactive Financial Analysis Using Python & Data Visualization

10 views

5d ago

Brian's Solutions
How To Create A 3d Graph In Microsoft Excel [2026 Guide]

Want every Excel formula & trick like this in one place? Get the Excel Essentials Kit (20+ page guide + 5 templates): ...

2:32
How To Create A 3d Graph In Microsoft Excel [2026 Guide]

11 views

3d ago

Frozzenrainbow
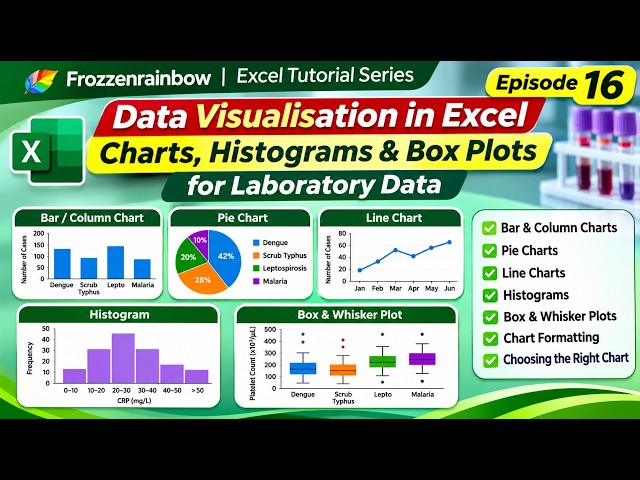
Data Visualisation in Excel | Bar Charts, Pie Charts, Histograms & Box Plots | Episode 16

Welcome to Episode 16 of the Frozzenrainbow Excel Tutorial Series! We are now entering the next phase of our Excel learning ...

6:23
Data Visualisation in Excel | Bar Charts, Pie Charts, Histograms & Box Plots | Episode 16

64 views

5d ago