Upload date
All time
Last hour
Today
This week
This month
This year
Type
All
Video
Channel
Playlist
Movie
Duration
Short (< 4 minutes)
Medium (4-20 minutes)
Long (> 20 minutes)
Sort by
Relevance
Rating
View count
Features
HD
Subtitles/CC
Creative Commons
3D
Live
4K
360°
VR180
HDR
47 results
Modern cloud environments generate enormous amounts of telemetry data, but how do you turn all that information into ...
1 view
9 min ago
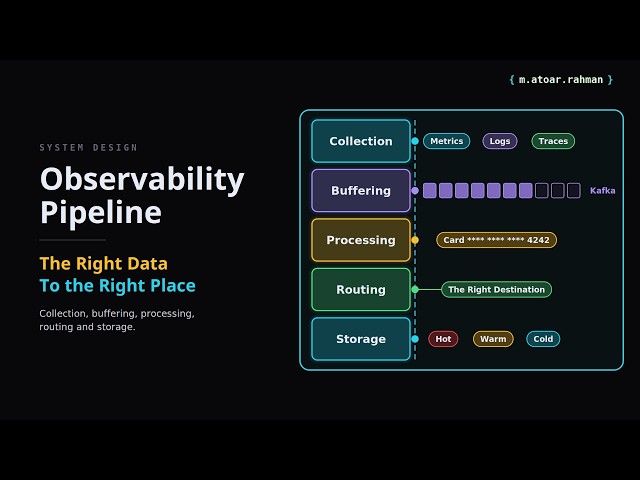
Every dashboard, alert, and distributed trace depends on telemetry reaching the right place at the right time. But as a system ...
9 views
16h ago
Netdata now collects OpenTelemetry traces right alongside your metrics and logs. Point your OpenTelemetry SDK or Collector at ...
14 views
7h ago
What if observability data could be stored and analyzed using open standards, without being locked into a single vendor or ...
2 views
5h ago
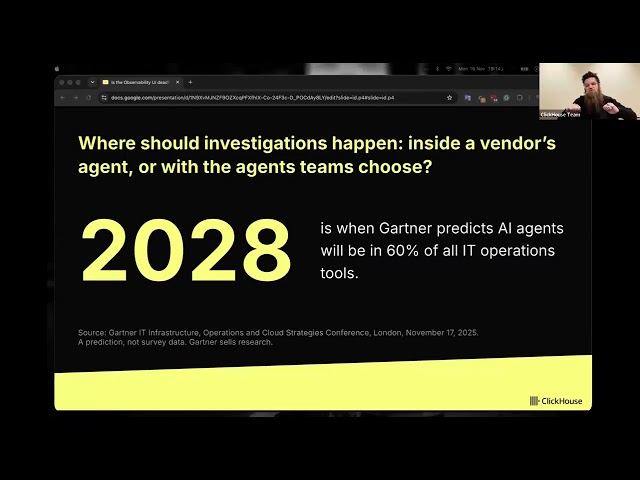
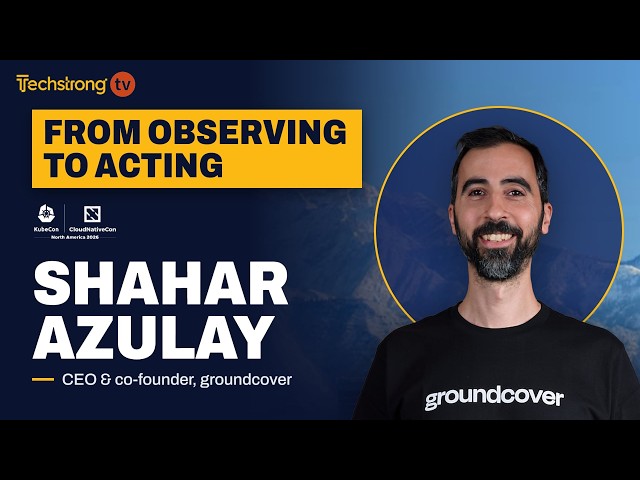
AI is changing how engineers investigate production systems. Agents are taking a more active role in exploring telemetry, testing ...
299 views
23h ago
The same AI agent, asked the same question about the same incident, gave a confidently wrong answer with 15 days of logs and ...
3 views
3h ago
AIOps has moved past the demo stage and into real on-call rotations, but its effectiveness sits somewhere between the hype and ...
34 views
10h ago
When Bayer's IT reorganization handed its team responsibility for thousands of applications — with no unified visibility — the ...
38 min ago
Telemetry often carries things it should not, like a customer's email address, and plenty of noise nobody will ever read.
11h ago
Everything so far ran on one machine, over plain HTTP, with no password. In this video we make our shop's telemetry ready for ...
OpenTelemetry in LogicMonitor works with the collector you already run, so there's no LM-specific collector to install. OTel metrics ...
17 views
Discover how to implement observability across production FastAPI applications using Prometheus and OpenTelemetry. Explore ...
13 views
1d ago
A feature can pass its tests and still leave one important question unanswered: when something goes wrong in production, will the ...
60 views
A Databricks SQL warehouse can say RUNNING while the dashboard is painfully slow. This episode shows how to separate ...
0 views
Full stack observability promises a complete view of the technology stack. In practice, network issues and application issues still ...
20h ago
Modern operations teams need visibility across an increasingly complex technology stack. In this session, discover how Microsoft ...
24 views
9h ago
When thredd, an AI-first issuer processor, consolidated onto Grafana Cloud, it unlocked something unexpected: AI that could find ...
10 views
37 min ago
Software and infrastructure are becoming autonomous. That shift makes AI observability more important than ever. Agents need ...
16 views
Try Bronto free: https://bronto.io/signup Docs: https://docs.bronto.io/welcome Book a demo: https://bronto.io/book-demo Blog: ...
21h ago
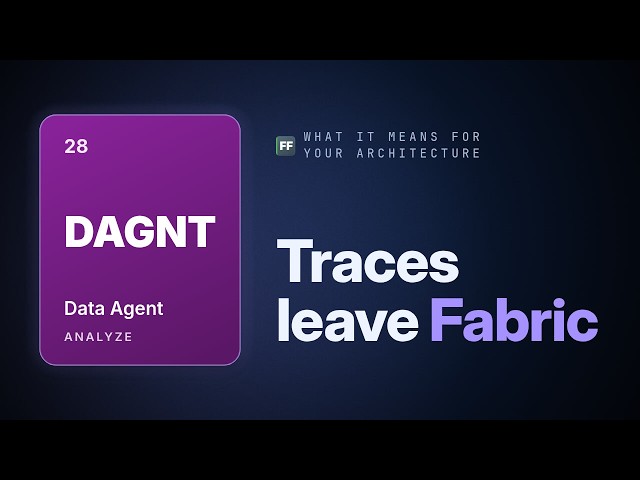
Fresh from Microsoft Ignite 2026: your data agent's telemetry can now leave Fabric. When an agent built in Microsoft Foundry calls ...
8h ago