Upload date
All time
Last hour
Today
This week
This month
This year
Type
All
Video
Channel
Playlist
Movie
Duration
Short (< 4 minutes)
Medium (4-20 minutes)
Long (> 20 minutes)
Sort by
Relevance
Rating
View count
Features
HD
Subtitles/CC
Creative Commons
3D
Live
4K
360°
VR180
HDR
349 results
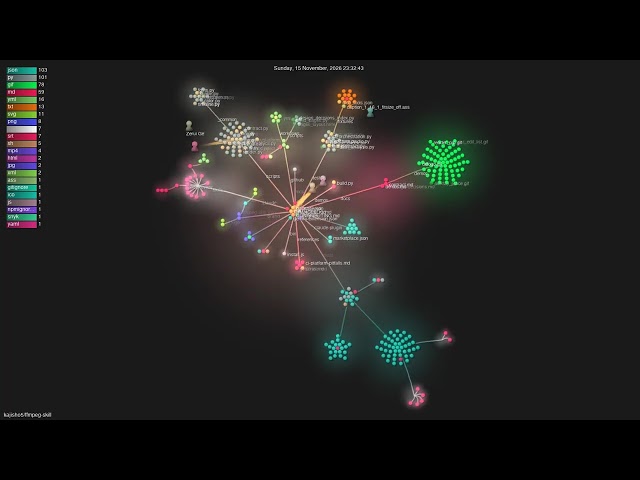
Watch the development journey of ffmpeg-skill by kajisho5! Local video editor for coding agents: 42 FFmpeg tools with a ...
24 views
18h ago
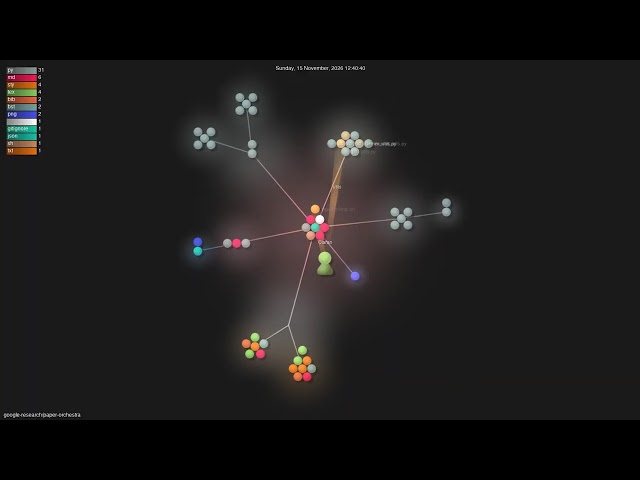
Watch the development journey of paper-orchestra by google-research! PaperOrchestra is a multi-agent framework for ...
17 views
7h ago
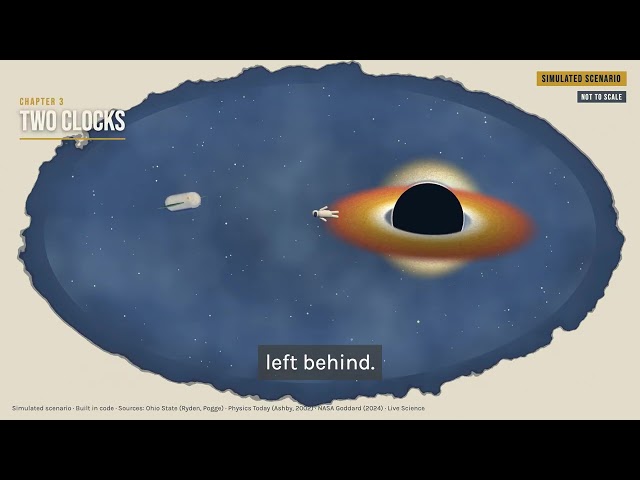
Fall into a big enough black hole, and you might not feel a thing at the edge. This is a simulated trip, step by step, with real physics ...
0 views
7 min ago
Try Hi3D V3.0 here: ...
8,608 views
15h ago
Try Hyper3D Agentic Mode: https://hyper3d.ai/features/image-to-3d?utm_source=YouTube&utm_medium=video&utm_campaign=Agentic ...
239 views
2h ago
THE BILLIONAIRE CODE 2027 💲 1111Hz Wealth Visualization | Financial Dominance 🚀 FOCUS YOUR MIND. BUILD YOUR EMPIRE ...
1,726 views
22h ago
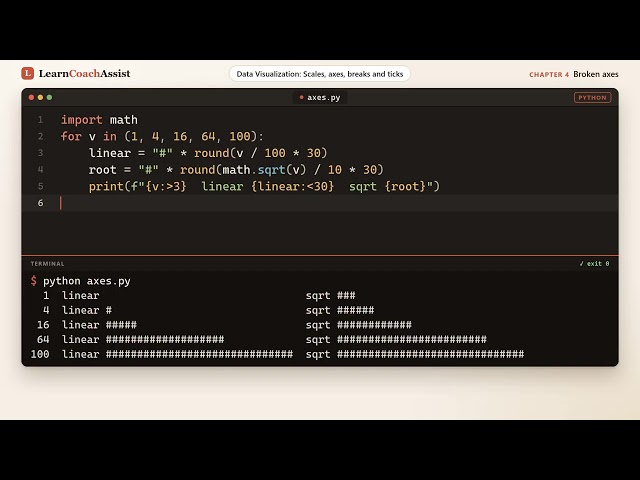
Learn data visualization in plain Python covering scales, axes, breaks, and ticks. You build a linear axis, a log axis with powers of ...
5h ago
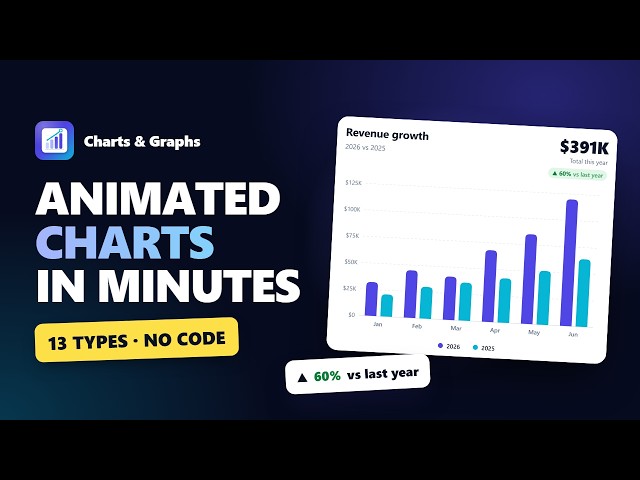
Turn your numbers into charts people remember! Pennine Technolabs is excited to introduce its Charts & Graphs Widget, now ...
2 views
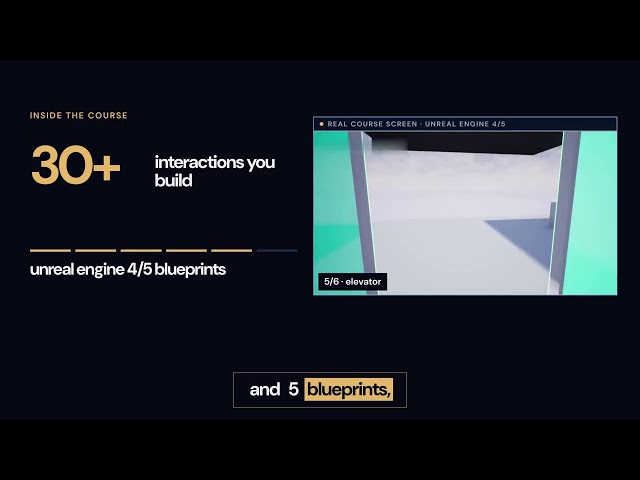
You don't need a programmer to make your archviz interactive. With Unreal Engine 4/5 Blueprints (boxes and wires, no code) the ...
4 views
1d ago
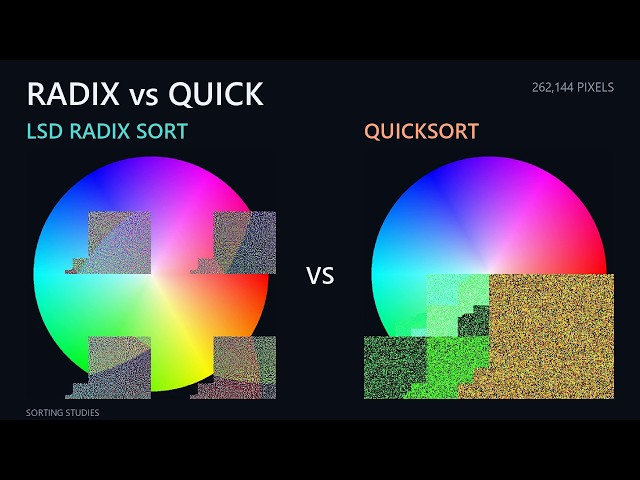
The challenge: rebuild the same color wheel with fewer data accesses. One access means one read or one write, including ...
3h ago
Tutorial for how to install the OSDR-BioData-API skills package in VScode Copilot. OSDR BioData API GitHub Repository: ...
11 views
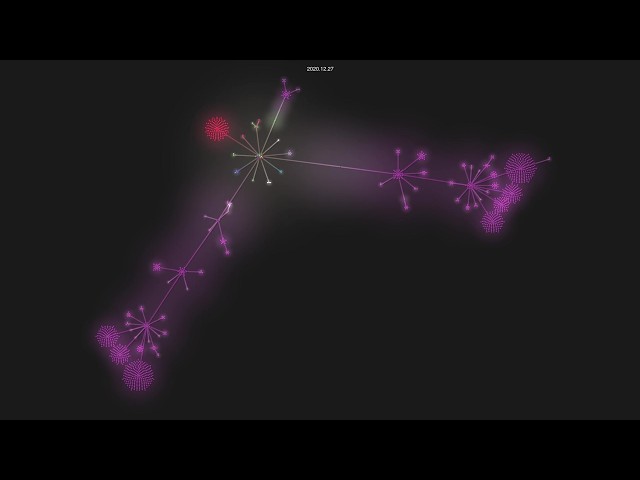
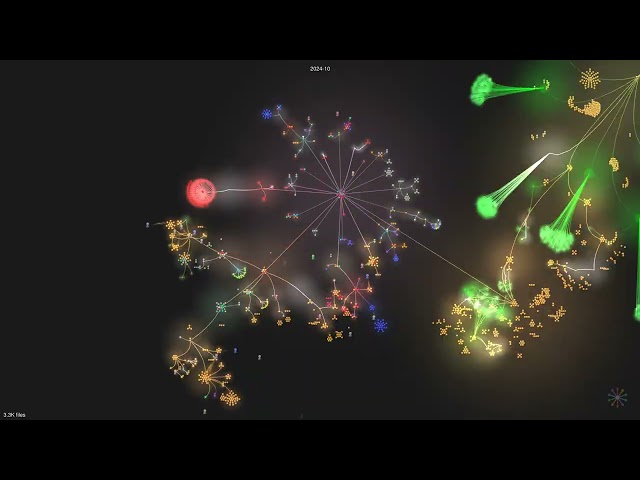
git history visualization of https://github.com/rubocop-hq/rubocop 8 years, 8 months of development, 806 contributors watch on ...
9 views
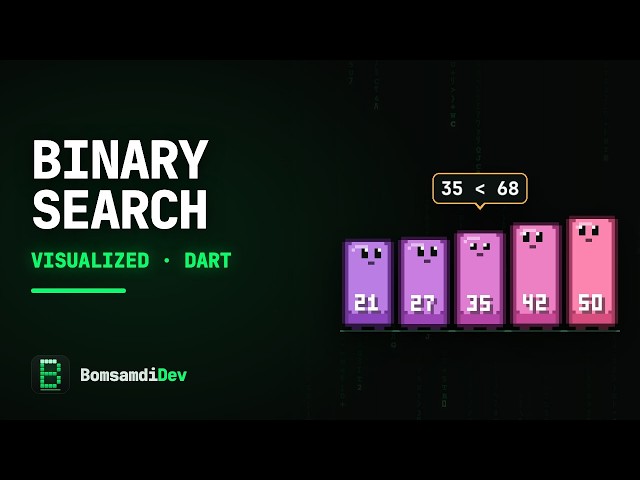
Watch binary search run for real in Dart: look at the middle, throw away half, repeat — every step on screen is taken from ...
3 views
DP-800 brings SQL development and AI together, but what does that actually mean for the exam? Get a fast, practical tour of the ...
1,792 views
Streamed 22h ago
AutoGPT is the vision of accessible AI for everyone, to use and to build on. Our mission is to provide the tools, so that you can ...
7 views
21h ago
Join this channel to get access to perks: https://www.youtube.com/channel/UC0nk24muIA7ix5z7DkpIGSg/join How to automate ...
9h ago
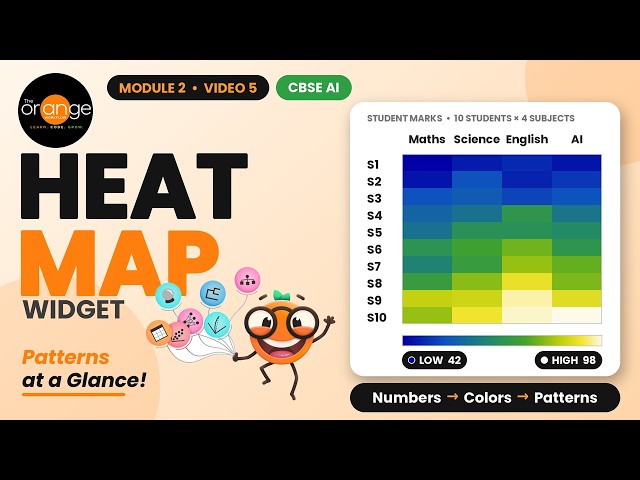
Heat Map Widget in Orange Data Mining | Data Visualization Tutorial | No Coding Can you analyze 400 numbers in just a few ...
1 view
6 min ago
Learn how to automate professional motion graphics using React and Remotion, without manually creating every animation from ...
44 views
23h ago
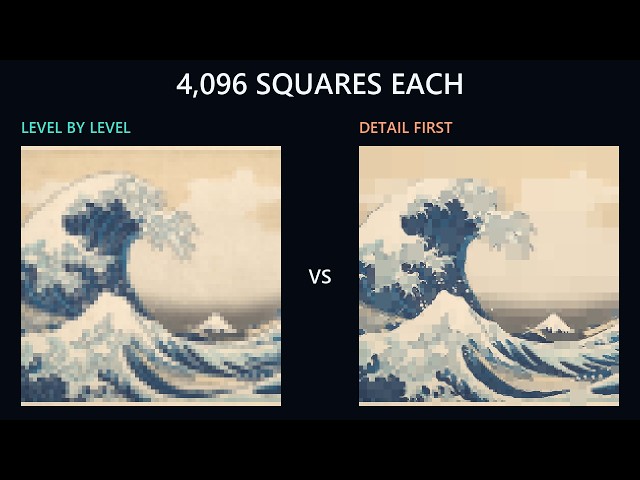
Two methods reconstruct the same print with a budget of 4096 squares each. Which preserves more detail? Each square uses the ...
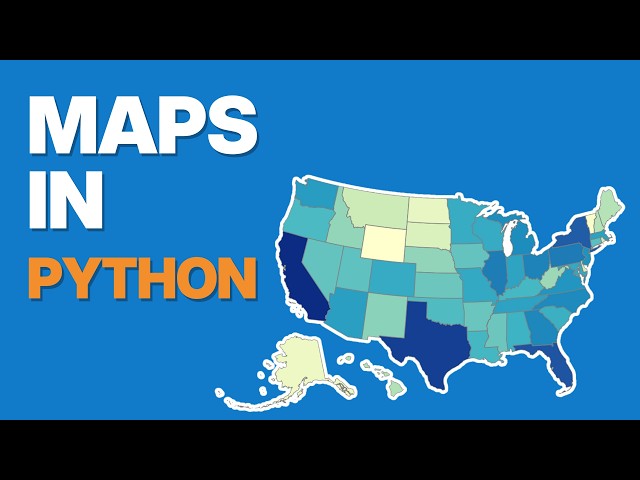
This video builds a map of US state populations using GeoPandas, pygris, and Polars—everything needed to go from a blank ...