ViewTube

ViewTube
Sign inSign upSubscriptions
Filters

Upload date

Type

Duration

Sort by

Features

Reset

408 results

Frozzenrainbow
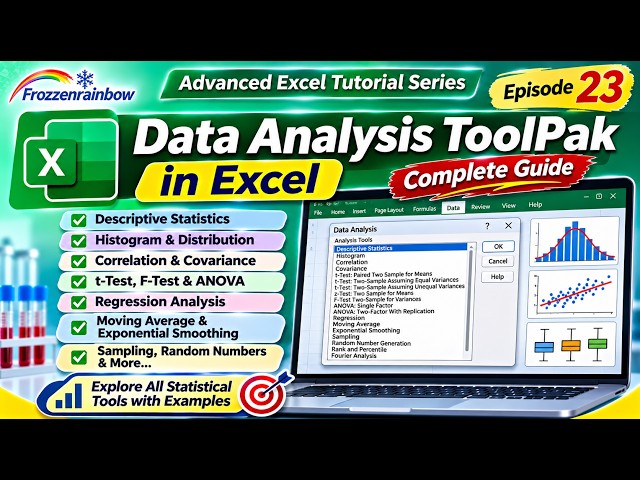
Data Analysis ToolPak in Excel | Complete Guide to Statistical Analysis Tools | Episode 23

Welcome to Episode 23 of the Frozzenrainbow Advanced Excel Tutorial Series! In this comprehensive tutorial, we explore the ...

8:57
Data Analysis ToolPak in Excel | Complete Guide to Statistical Analysis Tools | Episode 23

12 views

13h ago

Practical Data Science
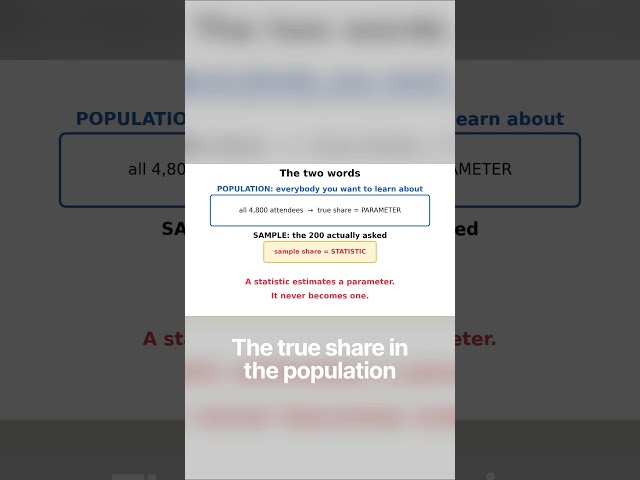
Samples and Populations, Made Simple!!! (Short)

Population vs sample, in under a minute: the population is everybody you want to learn about — all 4800 attendees. The sample ...

0:27
Samples and Populations, Made Simple!!! (Short)

12 views

1d ago

Practical Data Science
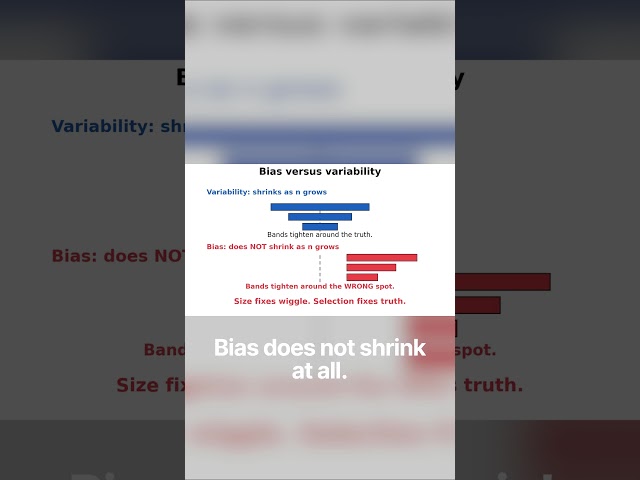
Samples and Populations, Made Simple!!! (Short) — Part 2

Sampling explained in under a minute: 132 of 200 fans said yes, 66 percent, yet a bigger sample cannot fix bias — a panel of only ...

0:21
Samples and Populations, Made Simple!!! (Short) — Part 2

7 views

58 min ago

DROMCA Learning
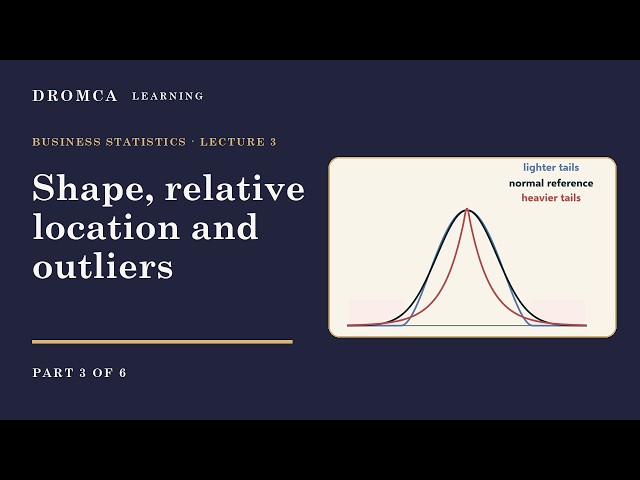
Skewness, Kurtosis, z-Scores and Outliers | Business Statistics, Lecture 3, Part 3

What shape does a distribution have, and where does one value stand within it? This part measures skewness and kurtosis, ...

7:18
Skewness, Kurtosis, z-Scores and Outliers | Business Statistics, Lecture 3, Part 3

0 views

10h ago

Akhilesh Kumar Singh
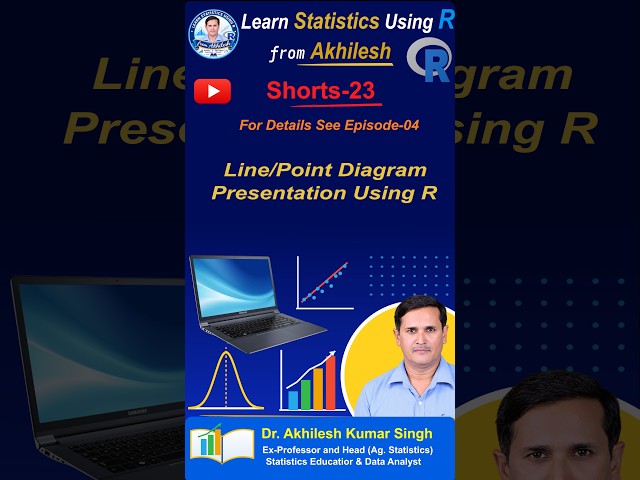
Line-Point Diagram Presentation Using R| #education | #rstats |  #statistics | #Rstudio | #Shorts 23

Line-Point Diagram Presentation Using R| #education | #rstats | #statistics | #Rstudio | #Shorts 23 This channel is "Learn Statistics ...

2:13
Line-Point Diagram Presentation Using R| #education | #rstats | #statistics | #Rstudio | #Shorts 23

36 views

1d ago

Practical Data Science
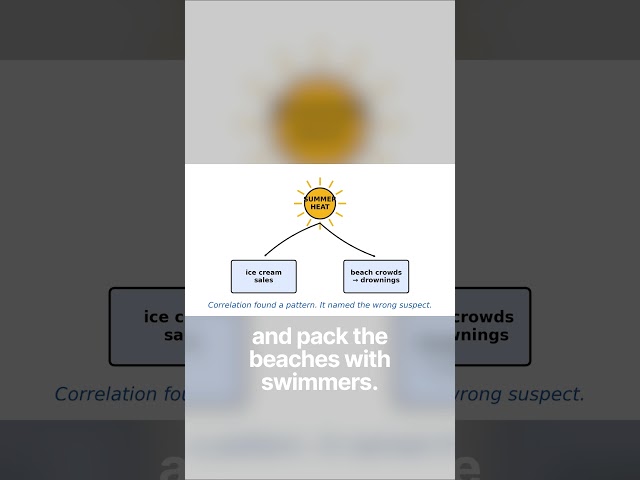
Correlation vs Causation, Made Simple!!! (Short)

Correlation vs causation explained in under a minute: ice cream sales track drowning deaths at r = +0.9, and the lurker behind ...

0:38
Correlation vs Causation, Made Simple!!! (Short)

6 views

1h ago

EzyMath
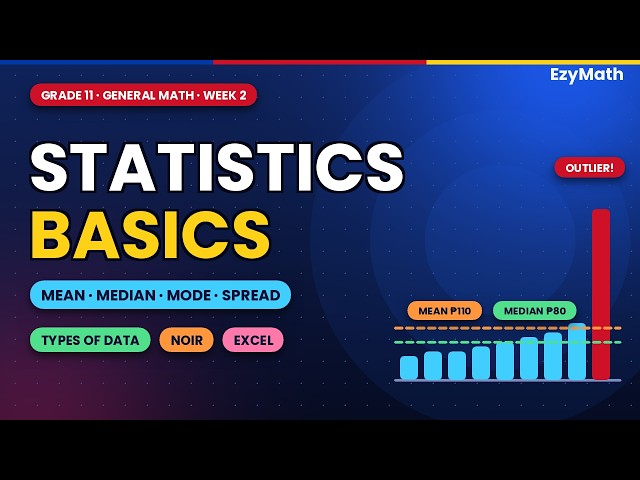
Statistics Basics | Types of Data, Mean, Median, Mode & Standard Deviation |Grade 11 General Math

Is the "average" always the best way to describe data? Not when there is an outlier! In this Grade 11 General Mathematics lesson ...

11:00
Statistics Basics | Types of Data, Mean, Median, Mode & Standard Deviation |Grade 11 General Math

16 views

14h ago

DataSoSi (CiAI) | Dr. Mark Lokanan
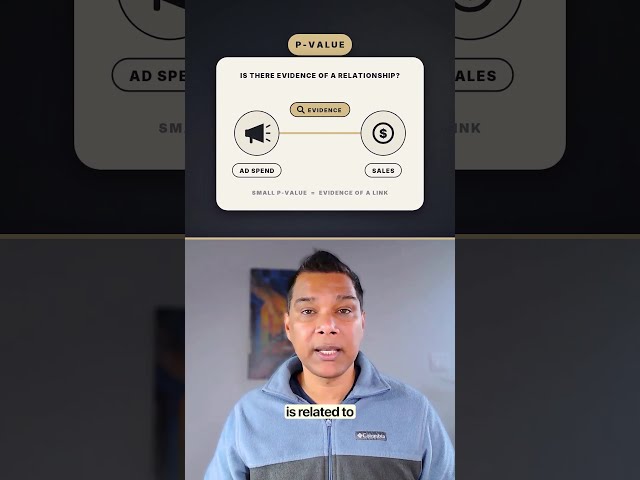
P-Value vs R-Squared: You're probably using them wrong #statistics #data #science

Master the difference between p-value and R-squared to improve your statistical modeling accuracy. This lesson clarifies how a ...

0:38
P-Value vs R-Squared: You're probably using them wrong #statistics #data #science

0 views

4h ago

Data Analysis By Tutor Nicholus
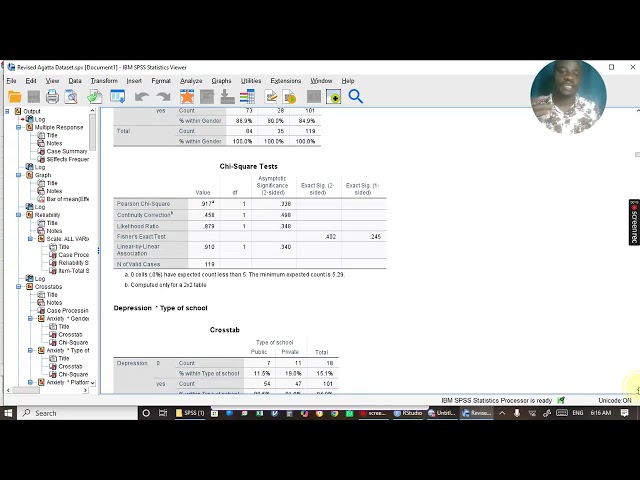
SPSS Data Analysis | Statistical Tests, Regression, ANOVA & Research Consulting | Tutor Nicholus

Need professional SPSS data analysis services? Transform raw datasets into meaningful statistical findings with professional ...

0:31
SPSS Data Analysis | Statistical Tests, Regression, ANOVA & Research Consulting | Tutor Nicholus

2 views

16h ago

DROMCA Learning
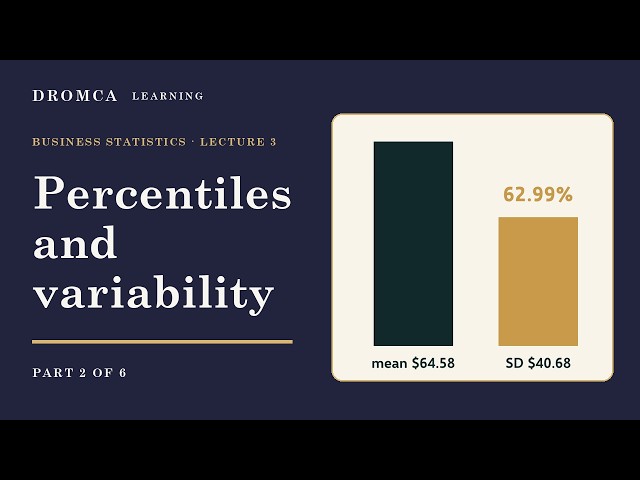
Percentiles, Quartiles, Variance and Standard Deviation | Business Statistics, Lecture 3, Part 2

Where does a value sit, and how spread out are the data? This part locates percentiles in sorted data, with interpolation between ...

9:15
Percentiles, Quartiles, Variance and Standard Deviation | Business Statistics, Lecture 3, Part 2

0 views

10h ago

Mathew K Analytics
Exploratory Data Analysis (EDA) in Pandas: Full Hands-on Project | Pandas Course #57

Why do homes near the California coast cost so much more? Is it the sea view, or simply that richer people live there? Today we'll ...

24:22
Exploratory Data Analysis (EDA) in Pandas: Full Hands-on Project | Pandas Course #57

14 views

19h ago

Dr Rizwana Mustafa
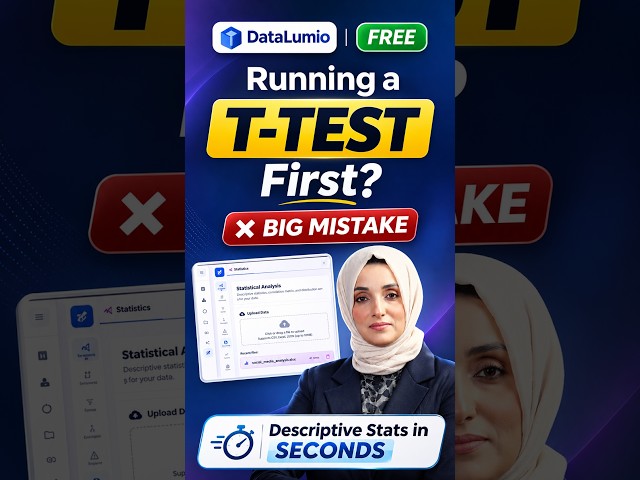
Running a T-Test First? That's a Big Mistake  | Free Descriptive Statistics  with DataLumio

Running a T-Test First? That's a Big Mistake ❌ | Free Descriptive Statistics in Seconds with DataLumio Acces the tool: ...

0:51
Running a T-Test First? That's a Big Mistake | Free Descriptive Statistics with DataLumio

74 views

10h ago

colino
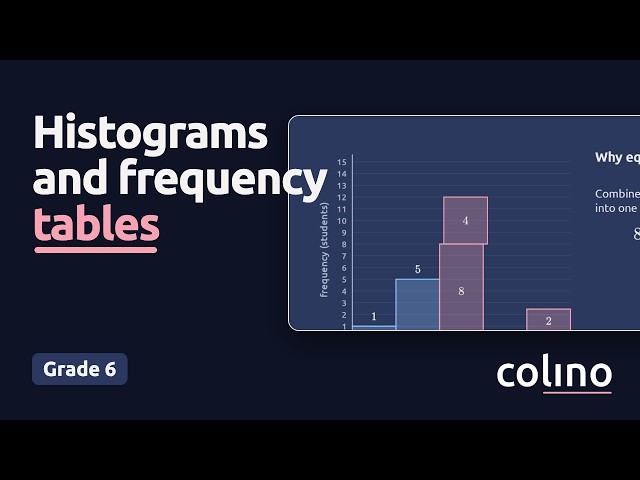
Histogram frequency table: how to group and read data

You can try colino for free here: https://colino.app/get/youtube In colino, you take photos of your math homework and get ...

4:58
Histogram frequency table: how to group and read data

2 views

17h ago

Data Analysis By Tutor Nicholus
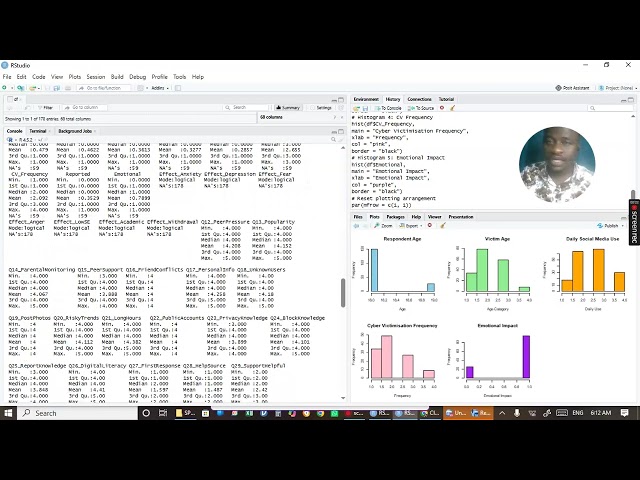
Data Analysis Using R | Statistical Analysis, Regression & Research Consulting | Tutor Nicholus

Learn how R programming transforms raw data into meaningful insights! Looking for professional data analysis and statistical ...

0:48
Data Analysis Using R | Statistical Analysis, Regression & Research Consulting | Tutor Nicholus

0 views

1d ago

BOOKS in 8 Minutes
Statistical Analysis with Excel For Dummies, 5th Edition by Joseph Schmuller (2022)

Statistical Analysis with Excel For Dummies, 5th Edition by Joseph Schmuller (2022) This Books in 8 Minutes episode breaks ...

7:43
Statistical Analysis with Excel For Dummies, 5th Edition by Joseph Schmuller (2022)

2 views

21h ago

Tech with Sundus
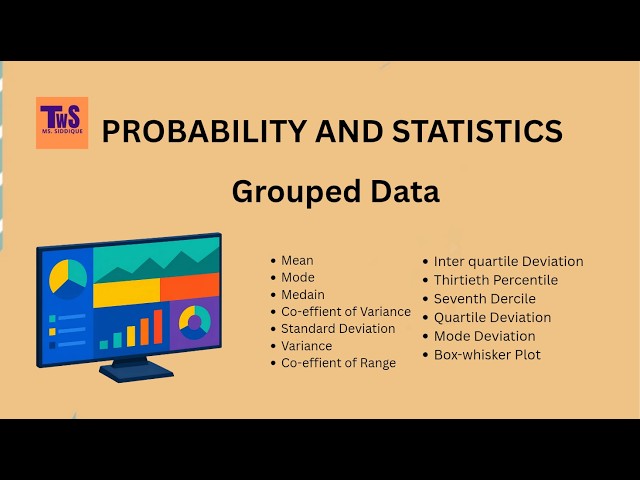
Grouped Data | Probability And Statistics | Part 2 | @TechwithSundus

0:00 intro 0:10 first quartile #maths #mean #medians #deviation #techwithsundus Mean Mode Medain Co-effient of Variance ...

15:31
Grouped Data | Probability And Statistics | Part 2 | @TechwithSundus

3 views

23h ago

Unemployed Renessaince Men
What Statistics Brings to the Machine: Samples, Uncertainty, and Honest Claims | Claudex Opus

Ten recordings of a machine running smoothly, all taken on one exceptionally pleasant Tuesday: what can they say about next ...

2:57
What Statistics Brings to the Machine: Samples, Uncertainty, and Honest Claims | Claudex Opus

2 views

1d ago

Robbie Pasquale
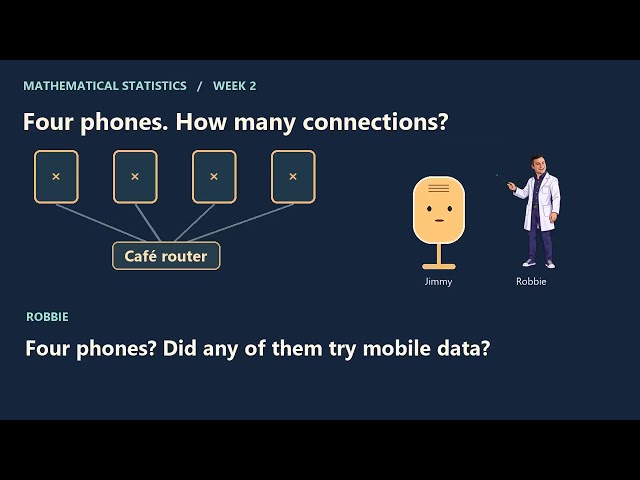
Sampling Distributions and Standard Error | Mathematical Statistics Week 2

If I run the same test twice, how far apart should I expect the results to be? This week Jimmy and I look at the spread of estimates ...

5:13
Sampling Distributions and Standard Error | Mathematical Statistics Week 2

5 views

19h ago

Infinity Systems
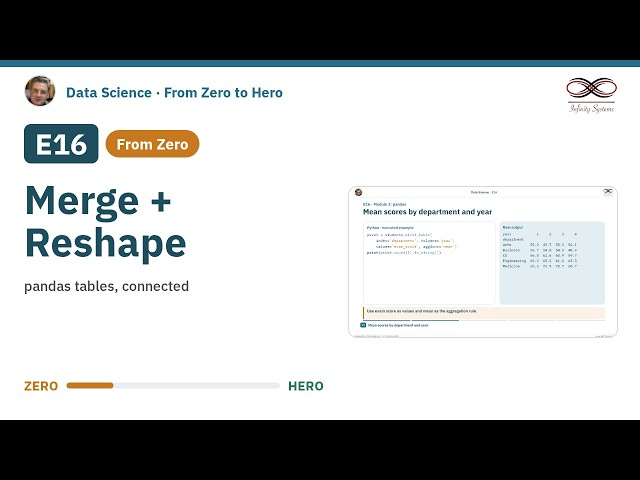
Merging, Joining and Reshaping Tables | Data Science E16

Learn to combine and reshape tables in pandas. We solve the E15 department exercise, then cover merge and join, join types ...

11:05
Merging, Joining and Reshaping Tables | Data Science E16

8 views

23h ago

Data Analysis By Tutor Nicholus
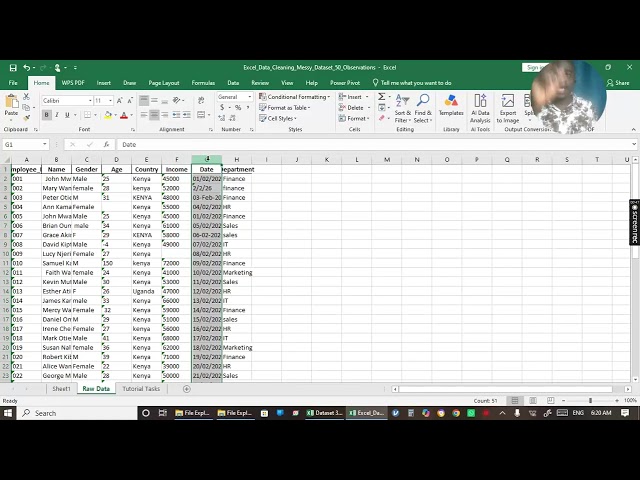
Data Analytics Using Microsoft Excel  | Tutor Nicholus

Transform raw data into meaningful business insights with professional Data Analytics Using Microsoft Excel. Looking for ...

1:38
Data Analytics Using Microsoft Excel | Tutor Nicholus

0 views

7h ago