ViewTube

ViewTube
Sign inSign upSubscriptions
Filters

Upload date

Type

Duration

Sort by

Features

Reset

105,810 results

Skills Outlet Data to AI
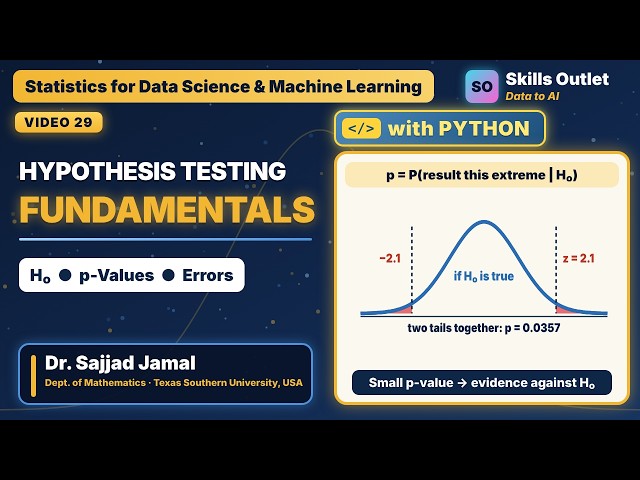
Hypothesis Testing & p-Values Explained | Statistics with Python (Video 29)

Statistics #HypothesisTesting #StatisticsWithPython Is a difference real, or just the luck of the sample? In Video 29, Dr. Sajjad ...

13:31
Hypothesis Testing & p-Values Explained | Statistics with Python (Video 29)

9 views

5d ago

The Data Classroom
Statistics for Data Science | Introduction: Population, Sample, Variables | FDS Unit 3 Topic 1

Why is statistics called the grammar of data science? In this first lesson of Unit 3 we learn what statistics is, the five questions it ...

12:04
Statistics for Data Science | Introduction: Population, Sample, Variables | FDS Unit 3 Topic 1

17 views

7d ago

Skills Outlet Data to AI
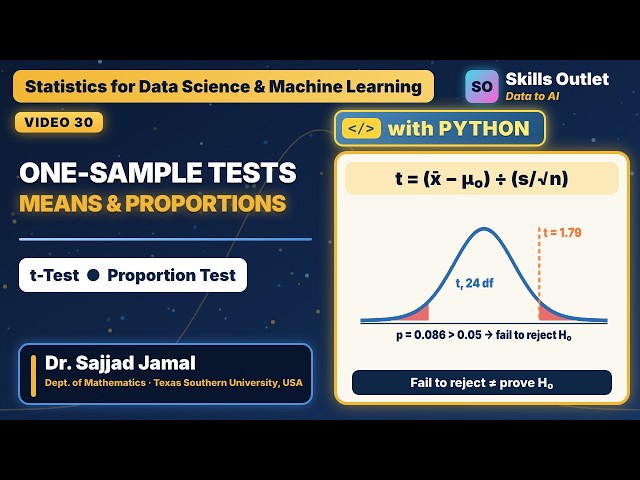
One-Sample t-Test & Proportion Test in Python | Statistics for Data Science (Video 30)

Statistics #TTest #StatisticsWithPython How do you test a claim about a single population? In Video 30, Dr. Sajjad Jamal builds on ...

15:01
One-Sample t-Test & Proportion Test in Python | Statistics for Data Science (Video 30)

6 views

5d ago

Tech Series
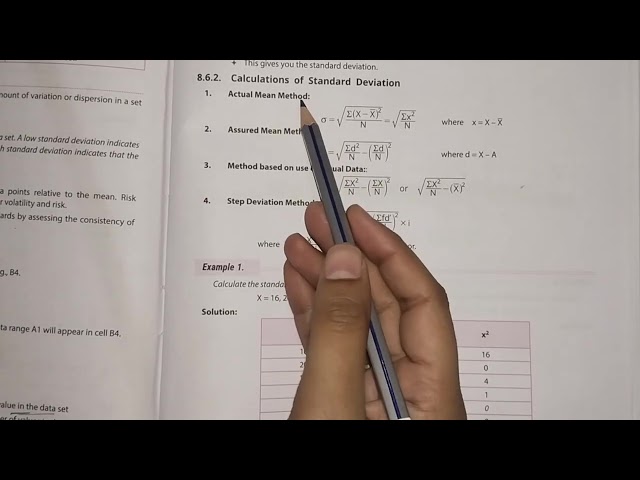
Standard Deviation in Statistics Using Excel | Data Science Tutorial | Step-by-Step Explanation

In this video, we will learn Standard Deviation in Statistics using Microsoft Excel with a simple step-by-step explanation in Hindi ...

5:53
Standard Deviation in Statistics Using Excel | Data Science Tutorial | Step-by-Step Explanation

27 views

5d ago

SyntaxPilot
Data Analytics Tutorial #34 | Which average tells the truth, and which one lies

Data Analytics Tutorial: Episode 34 of SyntaxPilot's free Data Analytics full course, with real-life examples for every concept.

15:08
Data Analytics Tutorial #34 | Which average tells the truth, and which one lies

1 view

2d ago

Practical Data Science
The Normal Distribution, Made Simple!!!

The Normal Distribution, Made Simple!!! What is the normal distribution, and why is the bell curve everywhere? Meet Norm — the ...

7:07
The Normal Distribution, Made Simple!!!

8 views

4d ago

NonLinear Academy
Practical Descriptive Statistics | Introduction to Data Science with pandas (Video 17)

Seventeenth episode of the NonLinear Academy series "Introduction to Data Science with pandas". We interpret means versus ...

2:32
Practical Descriptive Statistics | Introduction to Data Science with pandas (Video 17)

0 views

1d ago

SyntaxPilot
Data Analytics Tutorial #33 | Statistical charts from a DataFrame in one line

Data Analytics Tutorial: Episode 33 of SyntaxPilot's free Data Analytics full course, with real-life examples for every concept.

14:08
Data Analytics Tutorial #33 | Statistical charts from a DataFrame in one line

0 views

3d ago

Doug Rose
Lesson 18) Data Analysis Essentials for Product Managers

Ever wonder if you're looking at the right data? In this video, we dive into the importance of understanding statistics for Technical ...

3:35
Lesson 18) Data Analysis Essentials for Product Managers

5 views

2d ago

SyntaxPilot
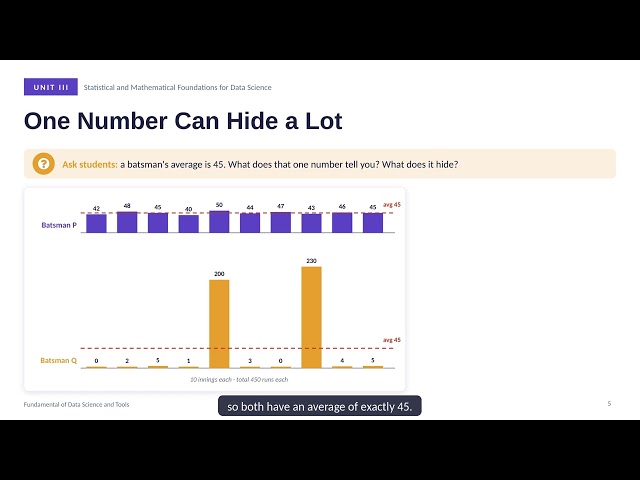
Data Analytics Tutorial #35 | Same average, completely different data: measuring spread

Data Analytics Tutorial: Episode 35 of SyntaxPilot's free Data Analytics full course, with real-life examples for every concept.

13:33
Data Analytics Tutorial #35 | Same average, completely different data: measuring spread

4 views

1d ago

Salek Data Lab
Python for Data Science — Class 03 | Data Cleaning, Visualization & Statistics

Python for Data Science — Class 03 | Data Cleaning, Visualization & Statistics **Salek Data Lab** In this class, we explore ...

43:04
Python for Data Science — Class 03 | Data Cleaning, Visualization & Statistics

52 views

7d ago

TECH Global University
Descriptive and Inferential Statistics Support Data-Driven Decisions | TECH Global University

Statistics provides scientific methods for collecting, organizing, and interpreting data to understand complex phenomena.

1:45
Descriptive and Inferential Statistics Support Data-Driven Decisions | TECH Global University

14 views

5d ago

Data Analysis By Tutor Nicholus
Data Analysis Using Python | Statistical Analysis, Regression & Data Science | Tutor Nicholus

Unlock the power of your data with professional Python data analysis services. Learn how Python can transform raw datasets into ...

1:18
Data Analysis Using Python | Statistical Analysis, Regression & Data Science | Tutor Nicholus

6 views

2d ago

Aventis Graduate School
Introduction to Data Science with R Data Science For Beginners

Data Science with R sponsored by SimplyLearn that's www.simplearn.com get certified get ahead my name is Richard Kersner ...

52:00
Introduction to Data Science with R Data Science For Beginners

8 views

3d ago

Neural Designer
17. How to Calculate Variable Statistics in Neural Designer

Calculate variable statistics in Neural Designer and explore minimums, maximums, means, and standard deviations using the Iris ...

2:32
17. How to Calculate Variable Statistics in Neural Designer

10 views

3d ago

Simplilearn
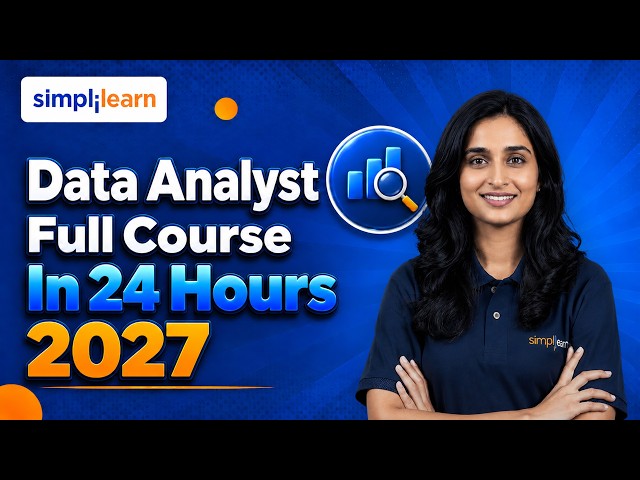
Data Analyst Full Course 2027 in 24 Hours | Learn Data Analytics Full Course 2026  Simplilearn

Micrososft Azure - Data Analyst Course ...

23:24:25
Data Analyst Full Course 2027 in 24 Hours | Learn Data Analytics Full Course 2026 Simplilearn

17,284 views

4d ago

Intellipaat
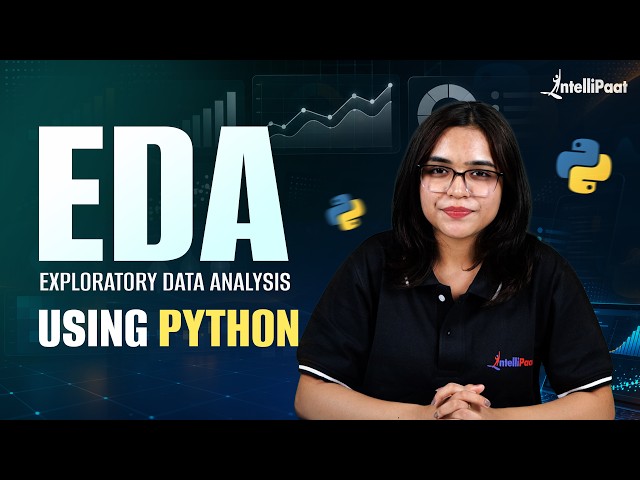
Exploratory Data Analysis in Python | Learn EDA with a Real Dataset | Part 1

Learn Exploratory Data Analysis (EDA) using Python with this hands-on tutorial for beginners! In this video, we'll explore a ...

53:22
Exploratory Data Analysis in Python | Learn EDA with a Real Dataset | Part 1

7,293 views

4d ago

Eklavik
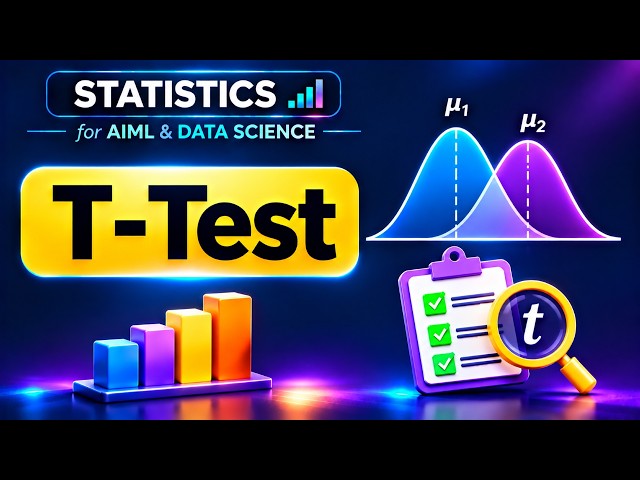
18. T-Test Explained for Beginners | Statistics for AI, ML & Data Science

T-Test is one of the most commonly used statistical tests for comparing means, especially when the sample size is small or the ...

9:37
18. T-Test Explained for Beginners | Statistics for AI, ML & Data Science

18 views

2d ago

Tech Series
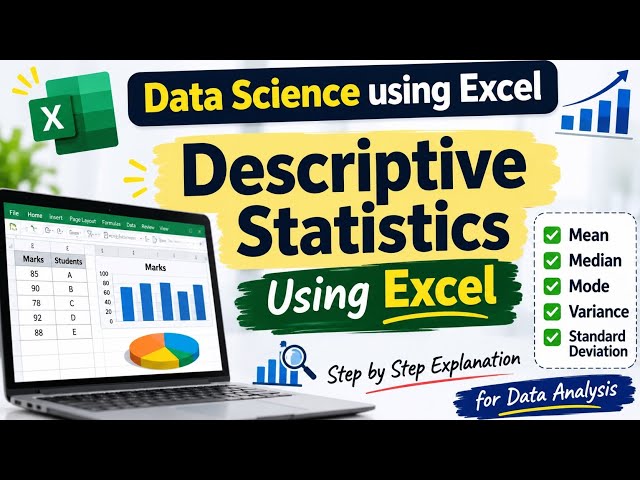
Descriptive Statistics in Excel | Mean, Median, Mode, Variance & Standard Deviation | Data Science

In this video, we will learn Descriptive Statistics using Microsoft Excel in a very easy way with practical examples and step-by-step ...

8:04
Descriptive Statistics in Excel | Mean, Median, Mode, Variance & Standard Deviation | Data Science

99 views

7d ago

EzyMath
Statistics Basics | Types of Data, Mean, Median, Mode & Standard Deviation |Grade 11 General Math

Is the "average" always the best way to describe data? Not when there is an outlier! In this Grade 11 General Mathematics lesson ...

11:00
Statistics Basics | Types of Data, Mean, Median, Mode & Standard Deviation |Grade 11 General Math

16 views

14h ago