Upload date
All time
Last hour
Today
This week
This month
This year
Type
All
Video
Channel
Playlist
Movie
Duration
Short (< 4 minutes)
Medium (4-20 minutes)
Long (> 20 minutes)
Sort by
Relevance
Rating
View count
Features
HD
Subtitles/CC
Creative Commons
3D
Live
4K
360°
VR180
HDR
8,676,785 results
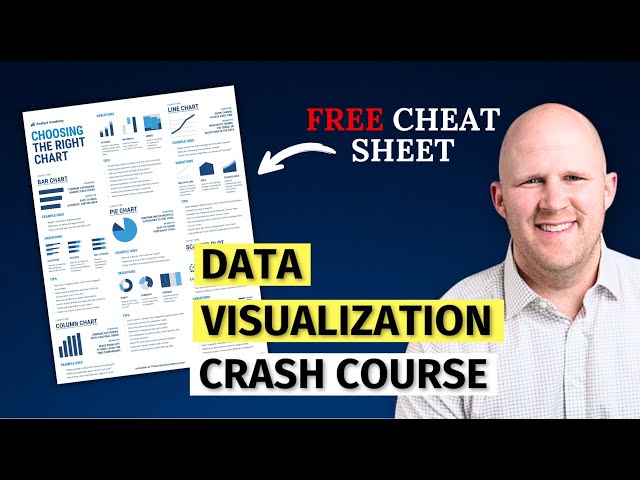
Links mentioned in this video ⬇️ Exercise File ...
267,215 views
3y ago
Micrososft Azure - Data Analyst Course ...
344,883 views
9y ago
View full lesson: http://ed.ted.com/lessons/david-mccandless-the-beauty-of-data-visualization David McCandless turns complex ...
1,616,391 views
13y ago
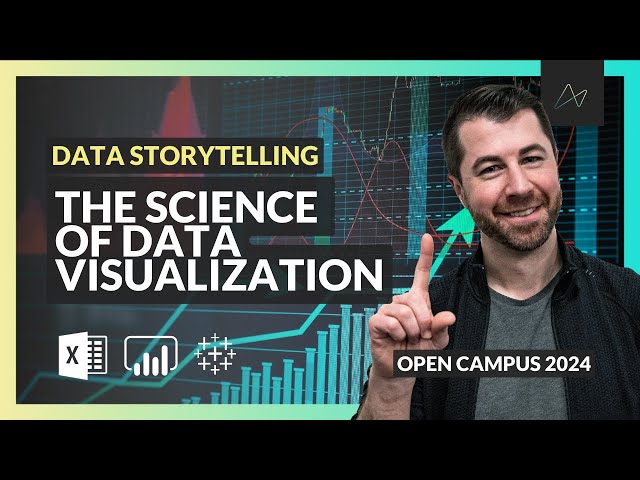
Early Black Friday Savings! Save $160 on a full year of Maven Pro https://bit.ly/4C13VCQ Data storytelling is one of the most ...
33,953 views
2y ago
13.6K subscribers
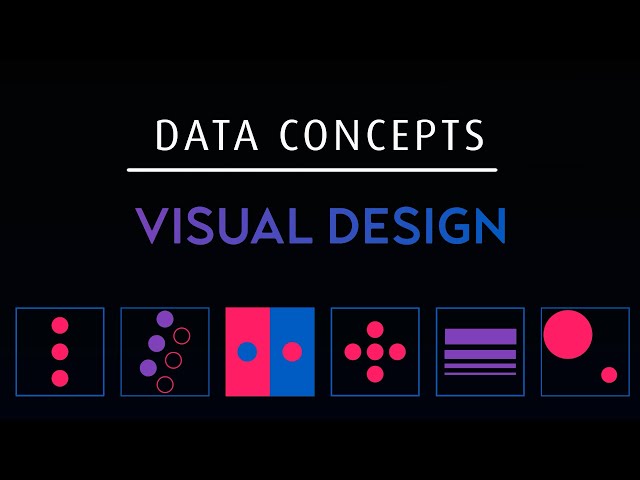
Let's look at how we can implement design concepts and techniques to maximize the impact of our dashboards and reports.
99,601 views
5y ago
Have you ever looked at a spreadsheet full of numbers and felt completely overwhelmed? You're not alone. That's why today ...
11,674 views
1y ago
MIT 14.310x Data Analysis for Social Scientists, Spring 2023 Instructor: Esther Duflo View the complete course: ...
107,220 views
FREE live training this Saturday, 21 Nov, 1 PM ET: the roadmap to get hired in data in 2027 ...
7,706 views
MENTORSHIP - Apply to work with me here → https://go.theanalyticsaccelerator.com/yt29 ABOUT THIS VIDEO Most analysts can ...
86,120 views
Ready to become a certified Cognos Analytics v12 Analyst? Register now and use code IBMTechYT20 for 20% off of your exam ...
14,041 views
Data visualization is present in every aspect of our lives - but is it really as unbiased as it's said to be? In this SciToons video, learn ...
155,092 views
7y ago
Viewers like you help make PBS (Thank you ) . Support your local PBS Member Station here: http://to.pbs.org/Donateoffbook ...
526,420 views
This comprehensive tutorial will teach you everything you need to know about Excel chart types, chart customization, and creating ...
129,537 views
Find out how data visualization transforms the way we consume information—and why it's such a powerful force in marketing and ...
180,514 views
15y ago
Welcome to the Complete Data Visualization in Python Course! In this full video tutorial, we're diving deep into the world of ...
327,112 views
Learn Data Visualization with D3, JavaScript, and React. Part 2: https://youtu.be/H2qPeJx1RDI Created by @currankelleher .
523,811 views
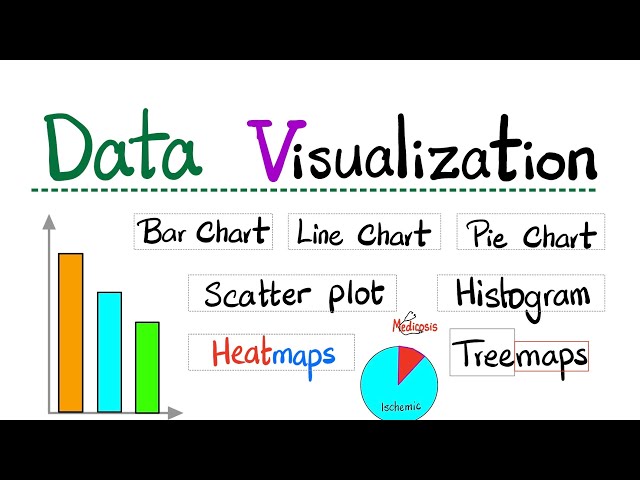
Data visualization, Bar chart, Line Chart, Pie chart, Scatter Plot, Pictogram, Histogram,Heat maps, tree maps, Dot plot, Stem and ...
9,743 views
In this video we take a look at the best resources to learn Data Visualization in 2025! 25% off Analyst Builder Code: ...
17,991 views