Upload date
All time
Last hour
Today
This week
This month
This year
Type
All
Video
Channel
Playlist
Movie
Duration
Short (< 4 minutes)
Medium (4-20 minutes)
Long (> 20 minutes)
Sort by
Relevance
Rating
View count
Features
HD
Subtitles/CC
Creative Commons
3D
Live
4K
360°
VR180
HDR
143,496 results
D3.js has landed in the SharePoint sandbox, and Copilot in SharePoint can now use it to build views that tell a story about your ...
1,188 views
5h ago
The course also covers statistics, data visualization, dashboard building, and AI-powered analytics so you can turn raw data into ...
4,956 views
9h ago
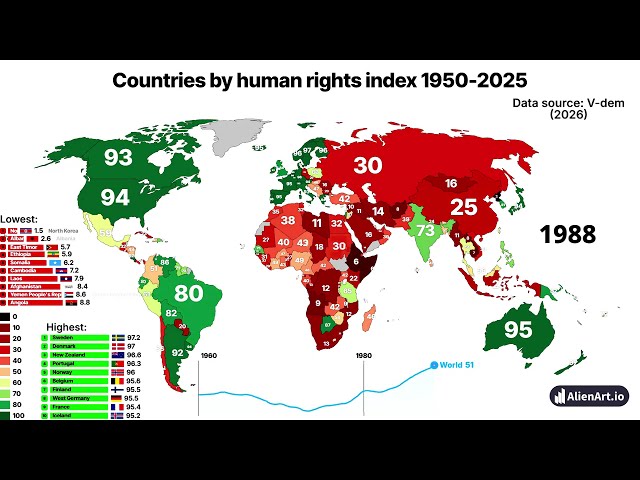
Countries by human rights index 1960-2025 | #humanrights #countries Source: V-dem (2026) Scale: 1 to 100 (lowest to highest)
4,367 views
2d ago
Catch up on everything new in Microsoft Fabric for November 2026. Get a quick rundown of this month's updates and see the new ...
7,621 views
1d ago
In this code-along webinar, David Benaim, a Data Visualization Consultant at Xlconsulting Asia, will show you how to use Claude ...
3,426 views
Streamed 7h ago
Discover the fundamentals of Data Visualization with Coding Kitty! Learn why visualization matters, explore different data types ...
3 views
Catch up on everything new in Power BI for November 2026. Get a quick rundown of this month's updates, see the new features in ...
27,576 views
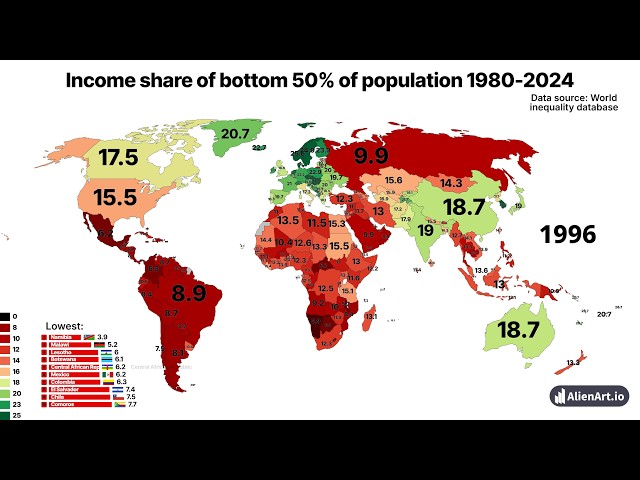
Explore global economic inequality in this detailed data visualization covering the income share of the bottom 50% of the ...
4,857 views
3d ago
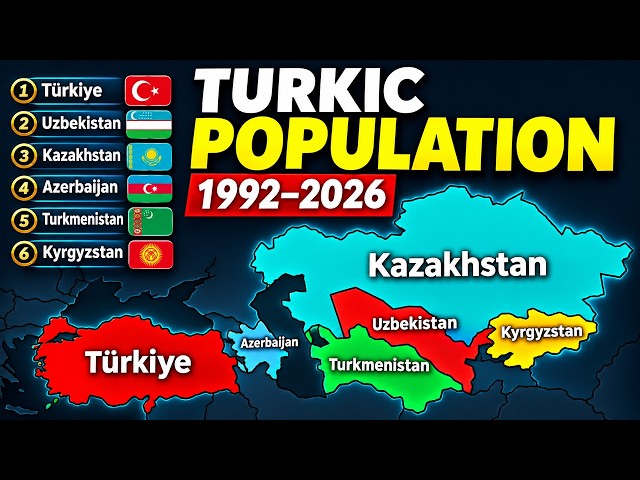
... #PopulationComparison #BarChartRace #DataVisualization #Turkey #Uzbekistan #Kazakhstan #Azerbaijan #Turkmenistan ...
18,476 views
This tutorial is for anyone looking to improve their data visualization efficiency. We cover the setup process and show how to ...
812 views
https://cppcon.org --- Real-Time Control, Simulation, and Visualization in C++23 With CUDA and Unreal Engine - Kevin Gomez ...
6,972 views
A picture is worth a thousand words... but are any of them true? Charts, graphs, and infographics can make information look clear, ...
37 views
6d ago
How to Visualize Data in Power bi [Updated 2026] Learn how to visualize data in Power BI with practical steps for building clear ...
15 views
Financial Intelligence Dashboard | Interactive Financial Analysis Using Python & Data Visualization Financial Intelligence ...
10 views
5d ago
Build your data visualization skills with Coding Kitty and learn to communicate insights with confidence! Explore more at ...
12 views
Enquiry: https://forms.gle/dhZhETccxuQTCBQB9 Learn Matplotlib in Python from scratch with this complete beginner-friendly ...
62 views
11h ago
GeoLibre v3.8.0 is here! GeoLibre is a free and open-source, lightweight, cloud-native GIS platform for visualizing, exploring, and ...
5,182 views
4d ago
In this video, we'll explore a real-world Food Delivery dataset using Python, Pandas, NumPy, and data visualization libraries.
5,030 views
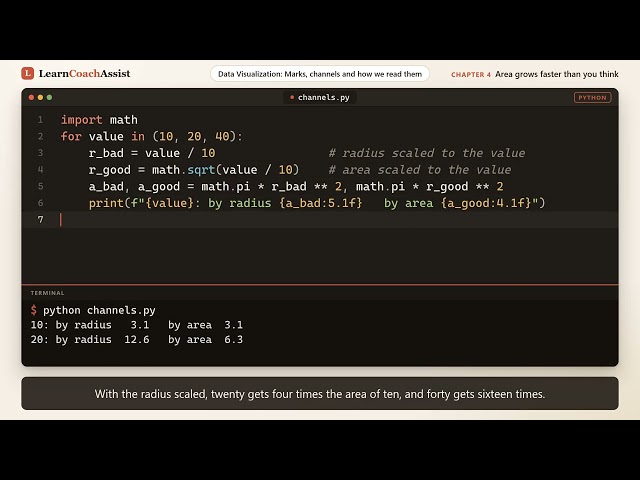
Learn data visualization in Python by exploring marks and channels, ranked by accuracy. You will build a dot plot, a text scatter ...
0 views
In data science, we often work with large amounts of numerical data. Looking at rows and columns of numbers can make it difficult ...
5 views