Upload date
All time
Last hour
Today
This week
This month
This year
Type
All
Video
Channel
Playlist
Movie
Duration
Short (< 4 minutes)
Medium (4-20 minutes)
Long (> 20 minutes)
Sort by
Relevance
Rating
View count
Features
HD
Subtitles/CC
Creative Commons
3D
Live
4K
360°
VR180
HDR
16,468 results
D3.js has landed in the SharePoint sandbox, and Copilot in SharePoint can now use it to build views that tell a story about your ...
916 views
4h ago
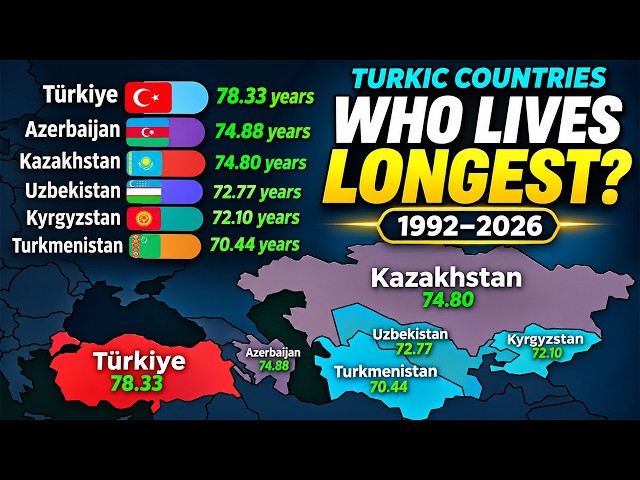
... both sexes combined #LifeExpectancy #TurkicCountries #Longevity #BarChartRace #DataVisualization #CountryComparison ...
1,817 views
8h ago
This tutorial is for anyone looking to improve their data visualization efficiency. We cover the setup process and show how to ...
503 views
The course also covers statistics, data visualization, dashboard building, and AI-powered analytics so you can turn raw data into ...
4,863 views
Imagine a single megacity housing the entire human race. How big would it be — and where could it fit? We use real population ...
0 views
20h ago
Enquiry: https://forms.gle/dhZhETccxuQTCBQB9 Learn Matplotlib in Python from scratch with this complete beginner-friendly ...
62 views
10h ago
In this video, we'll explore a real-world Food Delivery dataset using Python, Pandas, NumPy, and data visualization libraries.
5,001 views
9h ago
Learn data visualization in plain Python covering scales, axes, breaks, and ticks. You build a linear axis, a log axis with powers of ...
1 view
13h ago
In this code-along webinar, David Benaim, a Data Visualization Consultant at Xlconsulting Asia, will show you how to use Claude ...
3,372 views
Streamed 6h ago
Halo Bestie✨ Yuk, simak materi "Data Visualization with Microsoft Excel" dari tutor berpengalaman di Short Class Microsoft Excel ...
3,478 views
Streamed 1d ago
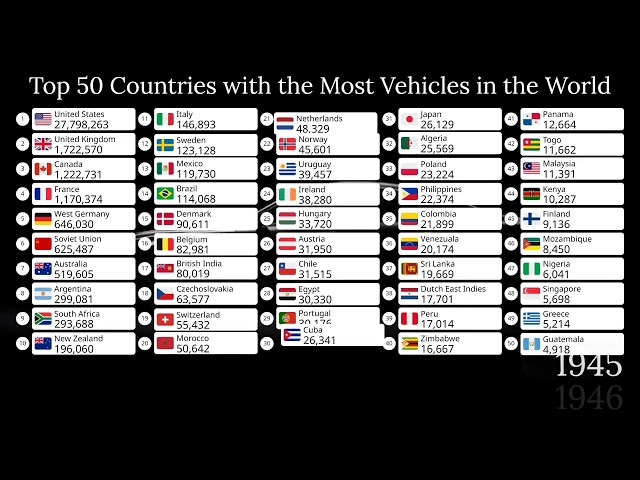
... automotive history, transportation, geography, economics, country rankings, infrastructure, and historical data visualizations.
3,759 views
17h ago
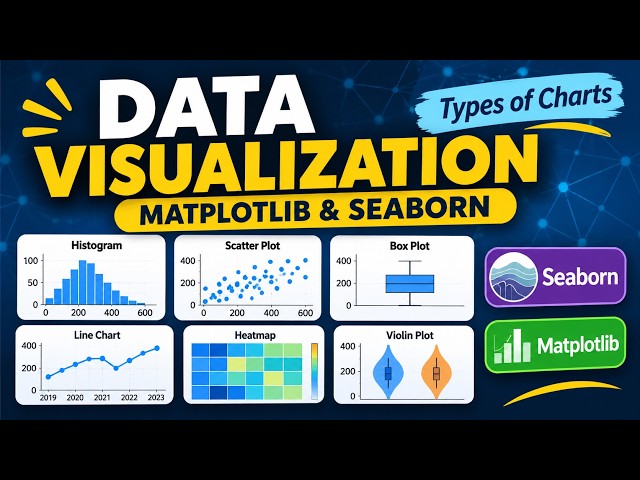
Welcome to Module 6: Data Visualization with Python! In this lesson, we explore different types of data visualization charts using ...
26 views
6h ago