Upload date
All time
Last hour
Today
This week
This month
This year
Type
All
Video
Channel
Playlist
Movie
Duration
Short (< 4 minutes)
Medium (4-20 minutes)
Long (> 20 minutes)
Sort by
Relevance
Rating
View count
Features
HD
Subtitles/CC
Creative Commons
3D
Live
4K
360°
VR180
HDR
69,020 results
Start building powerful data visualizations in Python! In Lesson 1 of our Matplotlib series, we cover everything you need to know to ...
15 views
2w ago
FREE CODE & DATASET AVAILABLE ON Official 5 Minutes Engineering Whatsapp Channel Description ...
6,434 views
3w ago
Enquiry: https://forms.gle/dhZhETccxuQTCBQB9 Learn Matplotlib in Python from scratch with this complete beginner-friendly ...
62 views
11h ago
To enquire about our AI driven courses, Fill the form below https://interest.entri.app/uRsgYKm Enquiry / Counselling: ...
862 views
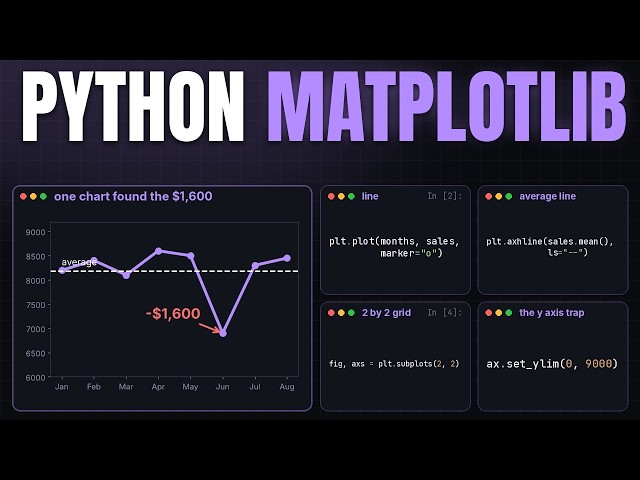
A coffee shop lost 1600 dollars in one month and the owner could not see why in her spreadsheet. One line chart showed it ...
17 views
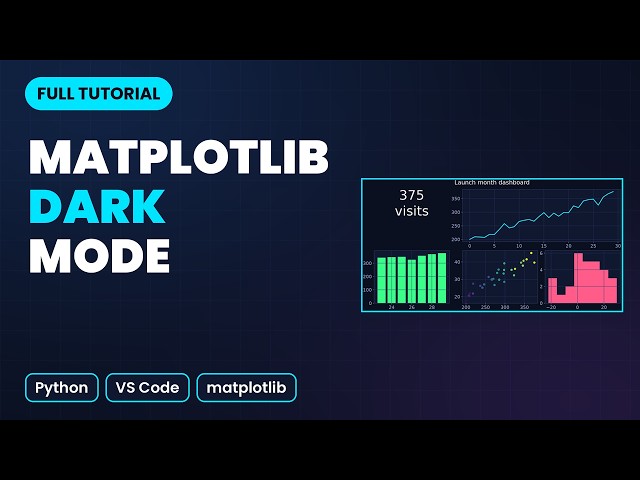
I take matplotlib from a blank file to a polished dark dashboard, typed live in VS Code in dark mode. The tutorial covers Figure and ...
27 views
Learn Python Data Science with NumPy, Pandas & Matplotlib! Explore data manipulation, analysis, and visualization with ...
97 views
1d ago
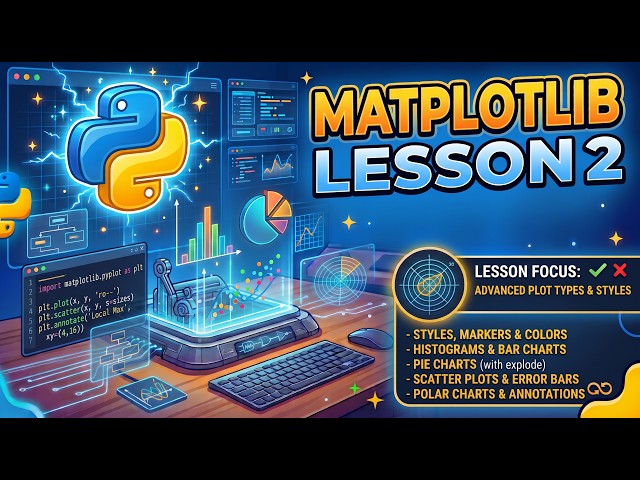
Take your Python data visualizations to the next level! In Lesson 2 of our Matplotlib series, we move beyond basic line graphs and ...
16 views