ViewTube

ViewTube
Sign inSign upSubscriptions
Filters

Upload date

Type

Duration

Sort by

Features

Reset

39,911 results

Marco Campolo
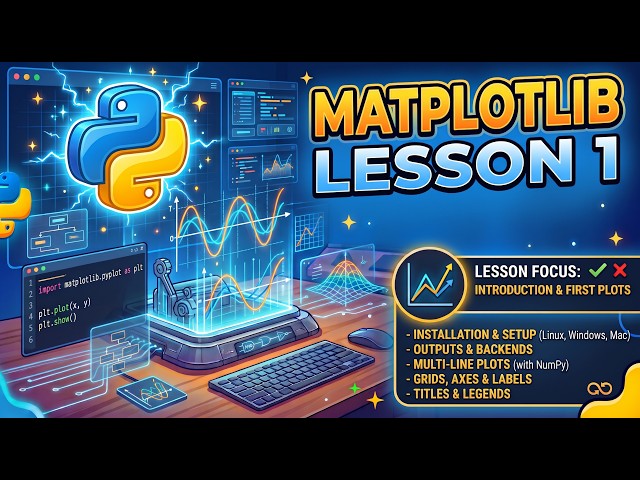
Matplotlib Lesson 1: Introduction, Setup & First Plots (Python Data Visualization)

Start building powerful data visualizations in Python! In Lesson 1 of our Matplotlib series, we cover everything you need to know to ...

16:33
Matplotlib Lesson 1: Introduction, Setup & First Plots (Python Data Visualization)

15 views

2w ago

5 Minutes Engineering
Matplotlib Full Course in One Shot | Data Visualization for Data Science and Data Analytics in Hindi

FREE CODE & DATASET AVAILABLE ON Official 5 Minutes Engineering Whatsapp Channel Description ...

2:37:58
Matplotlib Full Course in One Shot | Data Visualization for Data Science and Data Analytics in Hindi

6,434 views

3w ago

Tpoint Tech
Matplotlib Full Course in 40 Minutes 🔥 | Python Data Visualization for Beginners

Enquiry: https://forms.gle/dhZhETccxuQTCBQB9 Learn Matplotlib in Python from scratch with this complete beginner-friendly ...

40:36
Matplotlib Full Course in 40 Minutes 🔥 | Python Data Visualization for Beginners

62 views

11h ago

Entri Coding தமிழ்
Data Science Full Course for Beginners 2027 🔥 | Python, Pandas, Matplotlib & Seaborn – Part 2

To enquire about our AI driven courses, Fill the form below https://interest.entri.app/uRsgYKm Enquiry / Counselling: ...

20:52
Data Science Full Course for Beginners 2027 🔥 | Python, Pandas, Matplotlib & Seaborn – Part 2

862 views

3w ago

Help4code eLearning
Build Your First Data Analytics Project in Python NumPy, Pandas, Matplotlib

Learn Python Data Science with NumPy, Pandas & Matplotlib! Explore data manipulation, analysis, and visualization with ...

13:06
Build Your First Data Analytics Project in Python NumPy, Pandas, Matplotlib

96 views

1d ago

Math Unlocked
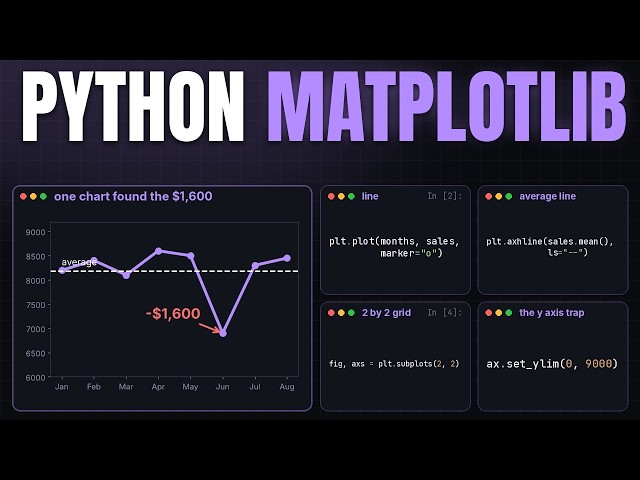
Give Me 7 Minutes, I'll Make Matplotlib Click (Line Charts, Subplots and a Real Sales Drop)

A coffee shop lost 1600 dollars in one month and the owner could not see why in her spreadsheet. One line chart showed it ...

7:55
Give Me 7 Minutes, I'll Make Matplotlib Click (Line Charts, Subplots and a Real Sales Drop)

17 views

2w ago

Back To Code
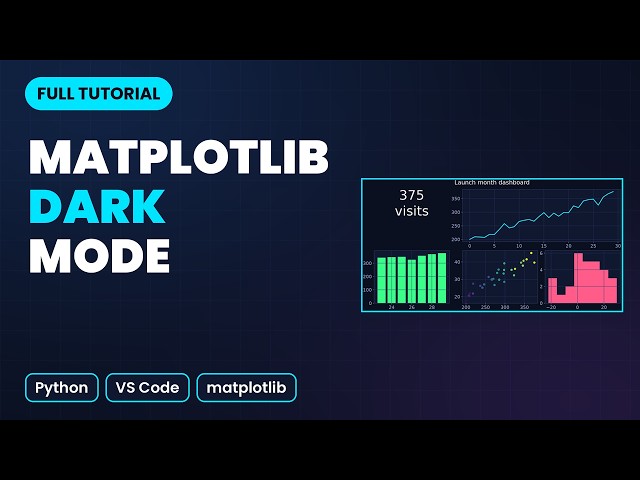
I Made Matplotlib Dark in 1 Line, Then Shrank an SVG 200x (Matplotlib, Python, VS Code)

I take matplotlib from a blank file to a polished dark dashboard, typed live in VS Code in dark mode. The tutorial covers Figure and ...

13:55
I Made Matplotlib Dark in 1 Line, Then Shrank an SVG 200x (Matplotlib, Python, VS Code)

27 views

2w ago

Marco Campolo
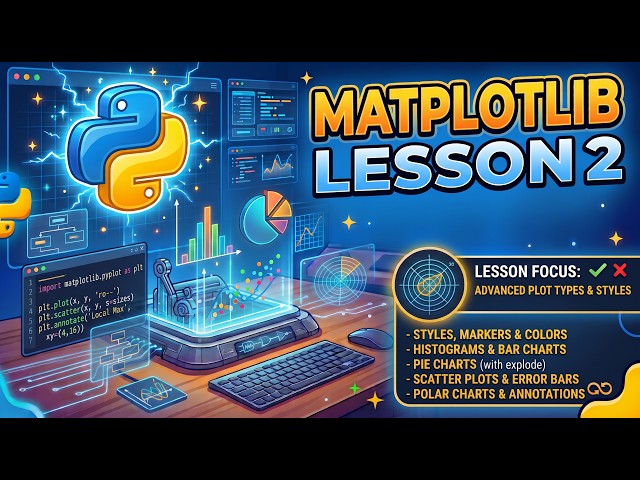
Matplotlib Lesson 2: Advanced Plot Types, Styling & Annotations

Take your Python data visualizations to the next level! In Lesson 2 of our Matplotlib series, we move beyond basic line graphs and ...

38:00
Matplotlib Lesson 2: Advanced Plot Types, Styling & Annotations

16 views

2w ago

Amit Thinks
How to Install Matplotlib in Python 3.15 on Windows 11 | Amit Thinks

In this video, learn how to install Matplotlib on Windows. We will also install Python 3 and pip. PIP is used to install and manage ...

3:26
How to Install Matplotlib in Python 3.15 on Windows 11 | Amit Thinks

1,039 views

4w ago

xanthium.enterprises
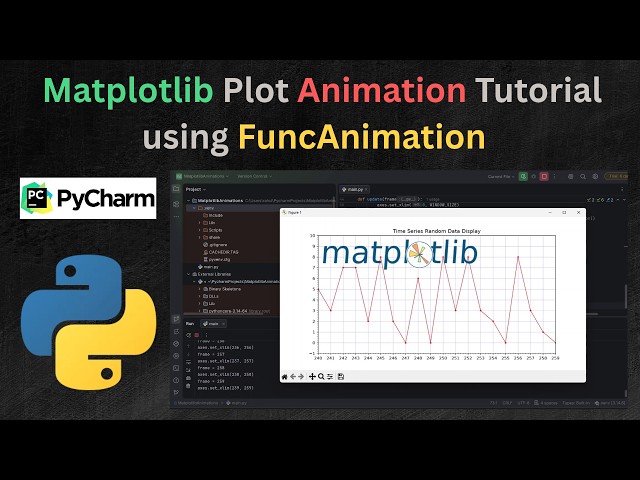
Matplotlib Real time Plot Animation Tutorial using FuncAnimation() and Python for Beginners

Like and Subscribe In this tutorial ,You will learn to create animated Matplotlib plots using the FuncAnimation() class and Python ...

28:08
Matplotlib Real time Plot Animation Tutorial using FuncAnimation() and Python for Beginners

255 views

2w ago

Koolac
Add Confidence Bands to Matplotlib Charts

Add Confidence Bands to Matplotlib Charts.

6:28
Add Confidence Bands to Matplotlib Charts

96 views

4d ago

AIMAGIC
Stop Making Boring Charts: Complete Matplotlib Masterclass

Master Python data visualization with Matplotlib from scratch! In this comprehensive masterclass, we cover everything you need ...

14:34
Stop Making Boring Charts: Complete Matplotlib Masterclass

18 views

4w ago

US Techworks
NumPy, pandas and Matplotlib Explained Simply (Data Basics for Machine Learning)

Every machine learning project starts with data: loading it, cleaning it, and looking at it. This video teaches the three Python tools ...

18:58
NumPy, pandas and Matplotlib Explained Simply (Data Basics for Machine Learning)

16 views

1d ago

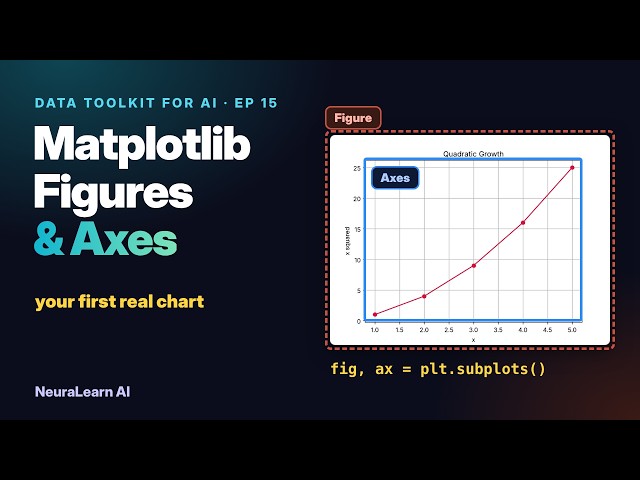
NeuraLearn AI
Matplotlib Figures & Axes Explained: plt.plot, Labels & fig, ax | Data Toolkit for AI Ep 15

Every Matplotlib chart is built from two objects: the Figure (the whole canvas) and the Axes (one plot with x and y scales; a Figure ...

1:45
Matplotlib Figures & Axes Explained: plt.plot, Labels & fig, ax | Data Toolkit for AI Ep 15

20 views

3w ago

Small Steps Studio
Python Setup for Data Analysis: Install Python, pandas and matplotlib (Part 2)

Set up Python for data analysis step by step: check your Python version, create a virtual environment, install pandas and ...

5:41
Python Setup for Data Analysis: Install Python, pandas and matplotlib (Part 2)

4 views

2w ago

Jakubication
How To Install matplotlib in Python 3.15.2

This video shows how to install matplotlib on Python 3.15.2 It will walk you through, step-by-step, how to install matplotlib on ...

2:09
How To Install matplotlib in Python 3.15.2

31 views

2w ago

Programming Avec Reza
The Only Matplotlib Tutorial You Need - From 0 To Pro in 5 Hours

Learn C++ and Python from Zero to Hero! Are you ready to master C++ or Python from scratch? Whether you're a beginner or ...

4:55:55
The Only Matplotlib Tutorial You Need - From 0 To Pro in 5 Hours

77 views

6d ago

Rubaiat Rahman
How to plot graphs with python - Matplotlib

Python Matplotlib Tutorial for Beginners | Essential Plotting Syntax In this tutorial, I demonstrate the essential Matplotlib syntax in ...

9:21
How to plot graphs with python - Matplotlib

79 views

3w ago

Stranger For Help
Matplotlib Tutorial | Python Data Visualization

Learn how to create beautiful charts and graphs using Matplotlib in Python. In this tutorial, we explore the basics of data ...

15:27
Matplotlib Tutorial | Python Data Visualization

184 views

3w ago

NeuraLearn AI
Matplotlib: Choosing the Right Chart for Your Question | Data Toolkit for AI Ep 18

A good chart starts before any code, with one question: what does the viewer need to compare? We put three wrong vs right chart ...

1:41
Matplotlib: Choosing the Right Chart for Your Question | Data Toolkit for AI Ep 18

1 view

2w ago