ViewTube

ViewTube
Sign inSign upSubscriptions
Filters

Upload date

Type

Duration

Sort by

Features

Reset

70 results

Tpoint Tech
Matplotlib Full Course in 40 Minutes 🔥 | Python Data Visualization for Beginners

Enquiry: https://forms.gle/dhZhETccxuQTCBQB9 Learn Matplotlib in Python from scratch with this complete beginner-friendly ...

40:36
Matplotlib Full Course in 40 Minutes 🔥 | Python Data Visualization for Beginners

62 views

11h ago

Himat Academy
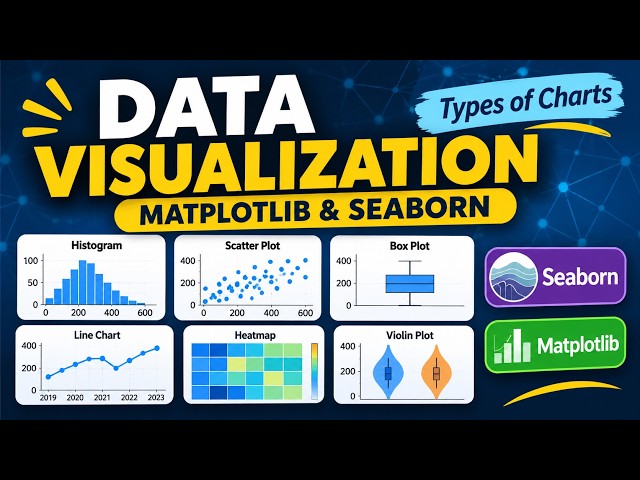
Data Visualization in Python | Matplotlib & Seaborn | Types of Charts | M6

Welcome to Module 6: Data Visualization with Python! In this lesson, we explore different types of data visualization charts using ...

27:41
Data Visualization in Python | Matplotlib & Seaborn | Types of Charts | M6

23 views

7h ago

Nemelion_Tronic
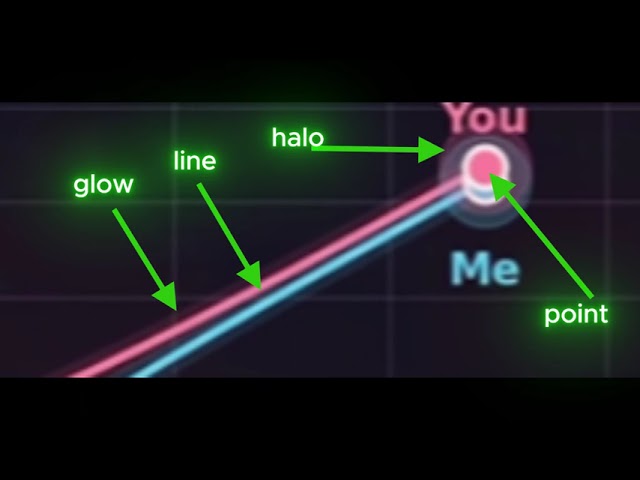
MATPLOTLIB - Animation de courbe

python #pythonprogramming #matplotlib #capcut #fyp #gabon #france #edit.

5:40
MATPLOTLIB - Animation de courbe

0 views

2h ago

SyntaxPilot
Data Analytics Tutorial #31 | See how your data is spread, related and compared

Data Analytics Tutorial: Episode 31 of SyntaxPilot's free Data Analytics full course, with real-life examples for every concept.

15:45
Data Analytics Tutorial #31 | See how your data is spread, related and compared

0 views

6h ago

Top VarSity
Python Full Course 2027 | Python for Data Analytics 2027 | Data Analysis with Python 2027

Microsoft Azure - Data Analyst Course ...

9:58:16
Python Full Course 2027 | Python for Data Analytics 2027 | Data Analysis with Python 2027

580 views

10h ago

だれでもパイソン (Python for All)
Calculating and Visualizing Pi: Python for Everyone, Episode 150

To make programming enjoyable for both adults and children, we will explain various Python programming concepts. Let's learn ...

20:17
Calculating and Visualizing Pi: Python for Everyone, Episode 150

1 view

4h ago

Neural Casts
SciPy 1.0: fundamental algorithms for scientific computing in Python — Pauli Virtanen et al.

SciPy 1.0—Fundamental Algorithms for Scientific Computing in Python by Pauli Virtanen, Ralf Gommers, Travis E. Oliphant, Matt ...

1:14:09
SciPy 1.0: fundamental algorithms for scientific computing in Python — Pauli Virtanen et al.

6 views

8h ago

Jacob Isah Programming Hub
My First 5 Python Projects in Jupyter (Beginner Friendly)

Build five practical Python projects in Jupyter Notebook to move beyond basic examples and gain hands-on coding experience.

15:33
My First 5 Python Projects in Jupyter (Beginner Friendly)

3 views

5h ago

LearnCoachAssistWatch
Data Visualization in Python: Scales, Axes, Ticks

Learn data visualization in plain Python covering scales, axes, breaks, and ticks. You build a linear axis, a log axis with powers of ...

5:12
Data Visualization in Python: Scales, Axes, Ticks

1 view

14h ago

BreakingThingsDown
The Cloud Atlas: How to Read Cumulus, Stratus and Cirrus

Four Latin words and a height are enough to name almost every cloud in the sky. Luke Howard's Latin cloud names, the ten main ...

2:47
The Cloud Atlas: How to Read Cumulus, Stratus and Cirrus

8 views

14h ago

Bioinformatics Insights
Drug Loading & Molecular Docking on Nanomaterials Using Python | Google Colab Tutorial

Click on this link: https://gumroad.com/products/ridbd Drug Loading & Molecular Docking on Nanomaterials | Python & Google ...

30:16
Drug Loading & Molecular Docking on Nanomaterials Using Python | Google Colab Tutorial

115 views

13h ago

DiMathData
Cómo dibujar un histograma con numpy y pandas y matplotlib
35:07
Cómo dibujar un histograma con numpy y pandas y matplotlib

0 views

3h ago

Don't Use This Code • James Powell
Make Your Science Relevant! | Software Skills for Open Science Part 2

Boost your open science skills with Open Science Experts from DUTC! Join the DUTC Discord Server: ...

21:02
Make Your Science Relevant! | Software Skills for Open Science Part 2

3 views

4h ago

Dev.com2055
Building FibreTrace: Multi-Provider ISP Fibre Network | Cisco, Python & Fault Analytics

What happens when a fibre network experiences connectivity problems? And how can we identify where the fault actually ...

30:28
Building FibreTrace: Multi-Provider ISP Fibre Network | Cisco, Python & Fault Analytics

8 views

11h ago

Amit Thinks
How to install Anaconda on Windows 11 (Updated 2026)

Learn to download and install Anaconda on Windows 11. We will also run a sample Python program after installation. Anaconda ...

4:19
How to install Anaconda on Windows 11 (Updated 2026)

275 views

18h ago

File Extension Geeks
How to Open V5D Files (Vis5D 5-Dimensional Dataset)

Can't get your Vis5D Dataset UNIX Chemical to open? You're not the only one! I'll walk you through the steps to open, preview, ...

3:47
How to Open V5D Files (Vis5D 5-Dimensional Dataset)

0 views

2h ago

ACTE Technologies
What Is Entropy? 🤖 | Data Science Tutorial | Part 2 | ACTE Technologies

What Is Entropy? | Data Science Tutorial | Part 2 | ACTE Technologies What Is Entropy in Machine Learning? | Information ...

1:04:58
What Is Entropy? 🤖 | Data Science Tutorial | Part 2 | ACTE Technologies

12 views

12h ago

PythonLife
AI Powered Data Analytics కొత్త Batch! | Excel, SQL, Python, Power BI & AI | PythonLife

100+ IT Full Courses in Telugu: ...

5:12
AI Powered Data Analytics కొత్త Batch! | Excel, SQL, Python, Power BI & AI | PythonLife

567 views

15h ago

Professor Py: AI Foundations
River ADWIN in Python: See How the Window Adapts When Errors Rise

Adaptive window (ADWIN) vs fixed lookback: detect rising model error rates sooner and avoid long-history dilution. Learn practical ...

9:09
River ADWIN in Python: See How the Window Adapts When Errors Rise

0 views

13h ago

BreakingThingsDown
Nvidia's Revenue Doubles to $116 Billion: What It Tells Us

Nvidia's sales more than doubled in a year and beat its own outlook, but in the last three months customers' unpaid bills and its ...

5:25
Nvidia's Revenue Doubles to $116 Billion: What It Tells Us

3 views

12h ago