Upload date
All time
Last hour
Today
This week
This month
This year
Type
All
Video
Channel
Playlist
Movie
Duration
Short (< 4 minutes)
Medium (4-20 minutes)
Long (> 20 minutes)
Sort by
Relevance
Rating
View count
Features
HD
Subtitles/CC
Creative Commons
3D
Live
4K
360°
VR180
HDR
622 results
This video shows how to use matplotlib on the Arrhenius HPC cluster, as part of the NAISS course 'Python for HPC', following the ...
7 views
1d ago
Enquiry: https://forms.gle/dhZhETccxuQTCBQB9 Learn Matplotlib in Python from scratch with this complete beginner-friendly ...
62 views
12h ago
code in video: https://github.com/Magicalbat/videos/blob/main/braille.c term_plot.h: https://github.com/Magicalbat/term-plot blot: ...
17,382 views
5d ago
Learn Python Data Science with NumPy, Pandas & Matplotlib! Explore data manipulation, analysis, and visualization with ...
96 views
Learn Matplotlib with Coding Kitty! Create line, bar, and scatter plots, histograms, and pie charts. Discover how to customize colors ...
1 view
Learn C++ and Python from Zero to Hero! Are you ready to master C++ or Python from scratch? Whether you're a beginner or ...
77 views
6d ago
Description: Ready to visualize data on the web using Python? In this step-by-step tutorial, we continue our series on building 8 ...
81 views
Do weekend diners tip better than weekday diners? It sounds like a one-chart question, but the honest answer takes a few charts ...
23 views
4d ago
3 Matplotlib Sikho Series in Python | plt.figure() & plt.subplots() Tutorial In this 3rd lecture of the Matplotlib Sikho Series, you'll ...
22 views
Short Description:** Learn Data Visualization using Matplotlib in Python with practical coding examples. Understand how to create ...
86 views
#2 Matplotlib Learn Series in Python | Install Matplotlib & Create Your First Graph Do you want to learn data visualization ...
35 views
2d ago
Add Confidence Bands to Matplotlib Charts.
Welcome to Module 6: Data Visualization with Python! In this lesson, we explore different types of data visualization charts using ...
7h ago
Short Description:** Continue learning Data Visualization using Matplotlib in Python with practical coding examples. Explore ...
21 views
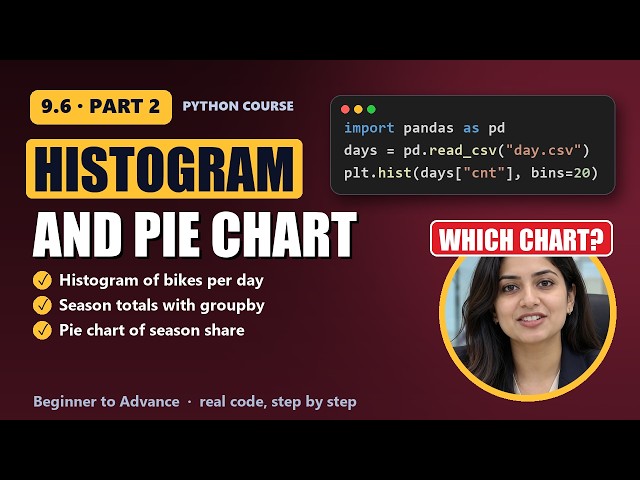
Learn Charts 2 in Python, step by step, with real code you can run: Why not a line?, Load pandas and matplotlib again, Read ...
10 views
Learn Charts 3 in Python, step by step, with real code you can run: Install and our data, Load pandas and matplotlib, Read the ...
6 views
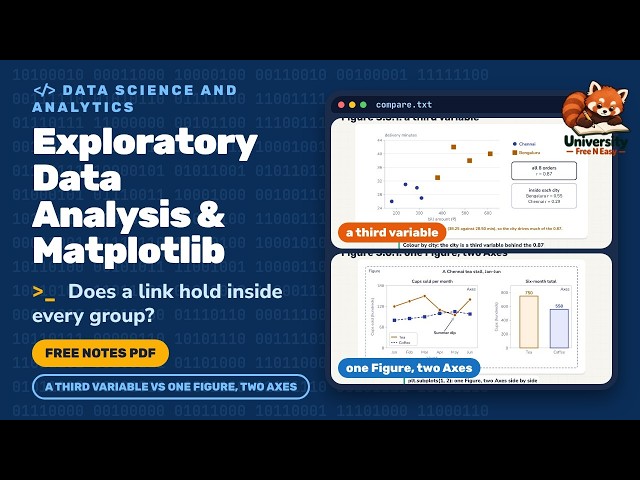
Exploratory Data Analysis and Matplotlib: Data Science and Analytics for B.Tech Computer Science, explained in one animated ...
4 views
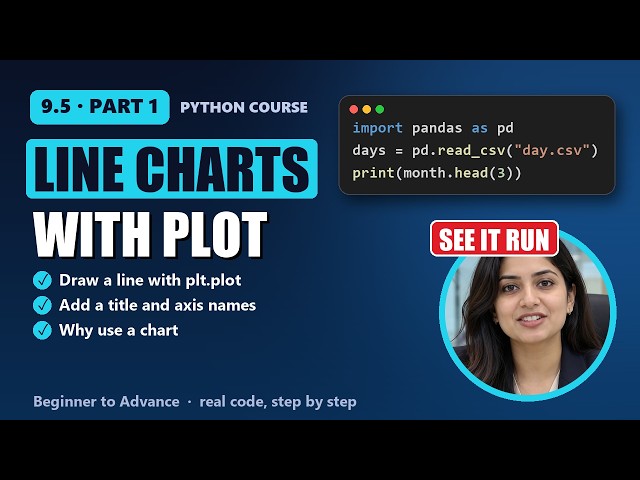
Learn Charts 1 in Python, step by step, with real code you can run: Why use a chart, Parts of a chart, Import pandas and matplotlib ...
5 views
Learn Charts 2 in Python, step by step, with real code you can run: Load pandas and matplotlib, Read the real day.csv file, ...
85 views